

In futures trading, tools that combine both price and volume can offer unique insights into market behavior. One of the most widely used tools among professional and retail traders alike is the Volume Weighted Average Price, or VWAP. This guide covers what VWAP is, how it’s calculated, how VWAP bands and anchored VWAP extend the concept, and how to manage risk around VWAP-based trades.
Key Takeaways
- VWAP blends price and volume into one benchmark. Volume Weighted Average Price shows where a futures contract has traded on average during the session, weighted by how much volume traded at each price level.
- Price relative to VWAP signals intraday bias. Trading above VWAP is generally read as bullish for the session, while trading below VWAP is read as bearish.
- VWAP bands turn a single line into a range. Adding standard deviation bands above and below VWAP helps traders spot when price has moved unusually far from the session average.
- Anchored VWAP and session VWAP serve different purposes. Standard VWAP resets each session, while anchored VWAP starts its calculation from a specific event, like a news release or contract roll.
- VWAP works best paired with a plan, not used alone. Combining VWAP with defined stops, dollar-risk position sizing, and other tools helps traders avoid the most common mistakes.
What is VWAP?
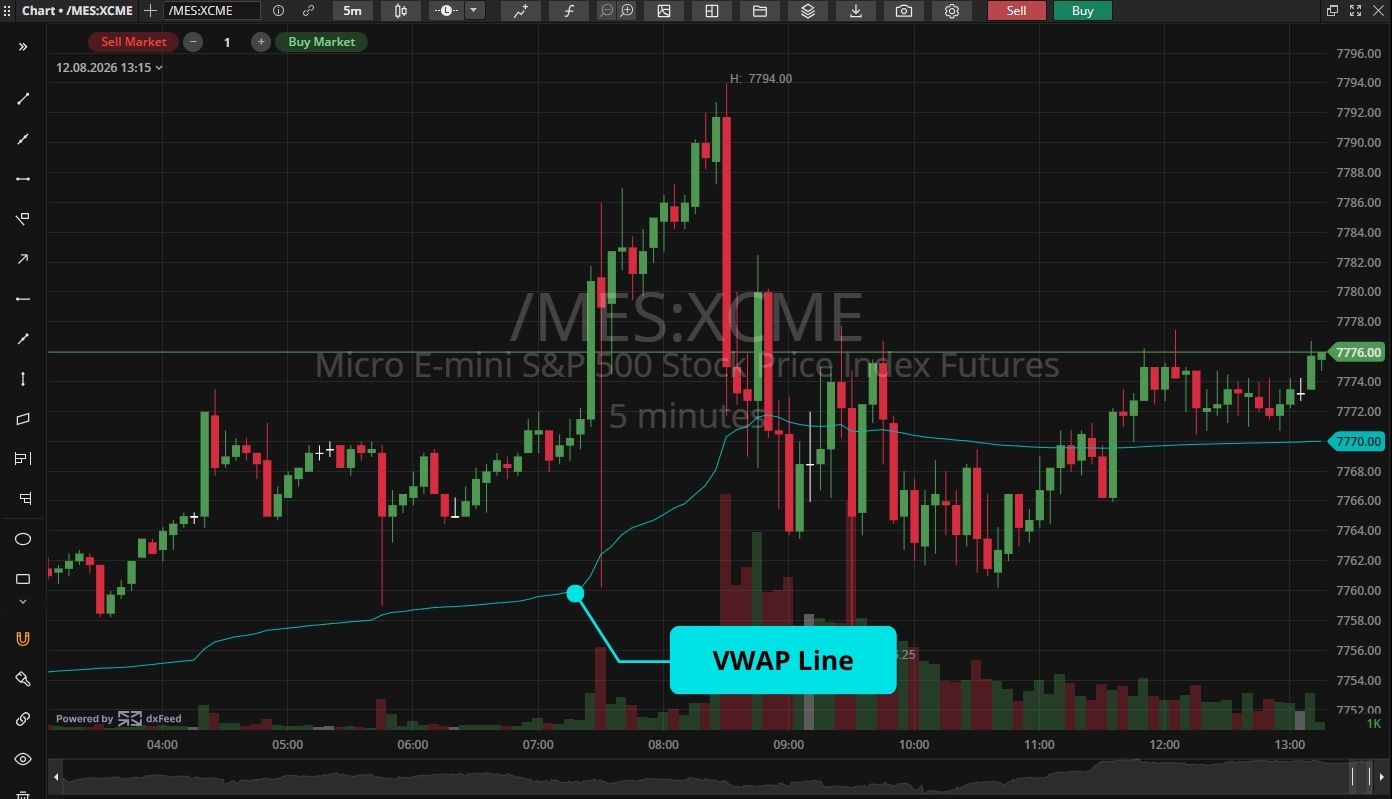
VWAP, or Volume Weighted Average Price, is a technical indicator that shows the average price of a futures contract throughout the day, weighted by trading volume.
Unlike a simple moving average (SMA), which calculates average price based only on closing values, VWAP gives more weight to price levels with higher volume. This makes VWAP a more accurate reflection of the price where most trading activity has occurred.
Traders often see VWAP as a “fair value” line. When price is above VWAP, the market is considered bullish for that session. When price is below VWAP, the market is seen as bearish.
How VWAP Is Calculated
VWAP is calculated using the formula:
VWAP = (Cumulative Price × Volume) ÷ Cumulative Volume
Here is how it works in practice:
- Multiply the price of each trade by the volume of that trade.
- Add up these values throughout the session.
- Divide the total by the cumulative trading volume.
For example:
|
Time |
Price |
Volume |
Price × Volume |
Cumulative Volume |
VWAP |
|
9:30 |
100 |
50 |
5,000 |
50 |
100.0 |
|
9:31 |
101 |
100 |
10,100 |
150 |
100.7 |
|
9:32 |
99 |
150 |
14,850 |
300 |
100.6 |
In this simplified table, VWAP is recalculated after each trade. Most trading platforms, including MetroTrader, handle these calculations automatically and display VWAP as a live, updating value.
Why VWAP Matters in Futures Trading
VWAP is especially important in futures markets because of their short-term and intraday nature. Here are a few reasons why traders pay close attention to VWAP:
- Fair Value: VWAP highlights the price level where most of the trading has taken place, helping traders understand what institutions may see as fair value.
- Trend Identification: Staying above or below VWAP provides a simple way to read intraday momentum.
- Trade Confirmation: VWAP helps confirm whether a breakout has real strength or is likely to fail.
- Market Efficiency: VWAP is often used as a benchmark for execution quality, especially by institutional traders.
VWAP vs. Moving Averages
At first glance, VWAP may look similar to a moving average. The table below breaks down the key differences.
|
Feature |
VWAP |
Moving Average (SMA/EMA) |
|
Resets daily |
Yes, at the start of each session |
No, continues across days and weeks |
|
Includes volume |
Yes, weighted by traded volume |
No, based on price only |
|
Best used for |
Intraday fair value and session bias |
Short-term and long-term trend direction |
For day traders in futures, VWAP often provides a clearer picture of where price sits relative to actual market participation, while moving averages remain more useful for spotting the broader trend across multiple sessions.
VWAP Standard Deviation Bands
VWAP on its own is a single line. Many traders extend it by adding standard deviation bands above and below the VWAP line. These bands measure how far price has statistically strayed from the session average, creating a range instead of a single reference point.
The bands are typically plotted at one and two standard deviations from VWAP. A move to the first band suggests price is starting to stretch away from fair value. A move to the second band suggests a more extended, statistically unusual move for that session.
Mean Reversion at the Bands
In range-bound or choppy sessions, price often pulls back toward VWAP after reaching an outer band.
Example Setup: A trader watching the E-mini S&P 500 (ES) sees price push out to the second standard deviation band above VWAP on relatively light volume, with no clear news catalyst. The trader waits for a reversal candle at the band, then enters a short position targeting a move back toward VWAP, with a stop placed just beyond the second band.
Pro Tip: Mean reversion at the bands works best when the overall session lacks a strong directional trend. Check the broader market context before fading a band touch.
Trend Days and “Walking the Band”
On strong trend days, price can hug one of the bands for an extended stretch instead of reverting to VWAP. Traders sometimes call this “walking the band.”
Example Setup: During a strong morning rally in Nasdaq-100 E-mini (NQ) futures, price holds consistently above the first standard deviation band instead of pulling back to VWAP. A trend-following trader stays in a long position, trailing a stop just below the first band rather than exiting on the first small dip.
Pro Tip: If price is walking the band rather than reverting, treat that as a signal the session is trending, not ranging. Forcing a mean reversion trade in this environment is a common source of losses.
Session VWAP, Rolling VWAP, and Anchored VWAP
Standard VWAP, sometimes called session VWAP, resets at the start of each new trading session and recalculates from scratch. This is the version most platforms display by default, including MetroTrader.
Anchored VWAP works differently. Instead of starting at the session open, it begins its calculation from a specific point the trader chooses, such as a news release, a contract rollover date, or a major swing high or low. Some traders and platforms use the term “rolling VWAP” to describe this same concept, since the calculation “rolls forward” from a custom anchor point rather than resetting daily. The terminology varies by platform, but the underlying idea is the same: the VWAP calculation begins at a chosen moment instead of the standard session open.
Anchored VWAP is useful in futures markets for analyzing reactions to:
- Economic announcements, such as CPI or jobs data.
- Federal Reserve interest rate decisions.
- Contract roll dates when liquidity shifts.
- Major price levels, such as a weekly high or low.
By anchoring VWAP to a meaningful event, traders gain a clearer picture of price relative to that specific moment, rather than the full trading session.
How Traders Use VWAP in Futures
VWAP has several practical uses in futures trading:
- Intraday Trend Identification: If price trades consistently above VWAP, it signals a bullish session. Below VWAP suggests a bearish session.
- Support and Resistance: VWAP often acts as a magnet, with price revisiting it throughout the day. Many traders treat it as a dynamic support or resistance line.
- Entry and Exit Points: Traders may enter on pullbacks toward VWAP or use it to confirm breakouts.
- Risk Management: Stops and profit targets can be set relative to VWAP, especially for short-term strategies.
VWAP Trading Strategies for Futures
Here are some of the most common ways traders apply VWAP in futures markets.
Mean Reversion Strategy
Price tends to revert to VWAP during the session. Traders look for overextended moves away from VWAP, often confirmed by a standard deviation band touch, and trade back toward it.
Breakout Confirmation
A breakout above resistance is stronger if it also occurs above VWAP. Similarly, breakdowns below support are more reliable when they happen below VWAP.
Trend-Day Pullback Using Bands
On days where price is walking a standard deviation band rather than reverting, traders can use pullbacks to the first band, instead of a full return to VWAP, as lower-risk entries in the direction of the trend.
Comparing Session and Anchored VWAP in Practice
Some traders plot both the standard session VWAP and an anchored VWAP from a recent news event on the same chart. When price sits above both lines, it adds confidence to a bullish read. When the two lines disagree, that’s often a sign the session is still digesting the event and conviction is lower.
Each of these strategies comes with advantages and risks. Mean reversion can fail in strongly trending markets, while breakout confirmation may deliver false signals in low-volume periods.
Real Scenario: Using VWAP to Trade Futures
Scenario 1: Micro E-mini S&P 500 (MES)
To see how VWAP works in practice, consider an example with Micro E-mini S&P 500 futures (MES).
Imagine the trading day begins with MES opening above VWAP. During the first hour, price pulls back toward VWAP and tests it as support. At this point, many day traders are watching to see if VWAP will hold.
- VWAP Support Holds: If MES bounces off VWAP and starts climbing, it confirms bullish intraday momentum. A trader might enter a long position near VWAP with a stop just below it, targeting the previous high of day.
- VWAP Breaks Lower: If MES falls through VWAP with strong volume, that signals bearish pressure. Traders could take short entries, placing stops just above VWAP, and target a move toward the morning session low.
- Choppy Action Around VWAP: Sometimes price chops around VWAP without clear direction. In this case, disciplined traders may avoid entering until a cleaner trend emerges.
This example shows why VWAP matters so much in MES and other equity index futures. Because these contracts are highly liquid, VWAP often acts as a magnet that traders watch closely.
Scenario 2: Gold (GC)
VWAP isn’t limited to equity index futures. Consider Gold futures (GC) reacting to a CPI inflation report released before the U.S. session open.
Example Setup: Ahead of the report, a trader plots an anchored VWAP starting from the release time, alongside the standard session VWAP. Gold spikes higher on the release, then pulls back toward the anchored VWAP line within the first 30 minutes. Price holds above the anchored VWAP on the pullback, and the trader enters a long position, with a stop placed just below the anchored VWAP line and a target near the post-release high.
Pro Tip: When trading around a scheduled economic release, anchoring VWAP to the exact release time gives a more relevant reference point than the standard session VWAP, which includes pre-release price action that isn’t representative of the new information.
Open Your Account Today
Start trading futures with ultra-low commissions and margins as low as $50.
Managing Risk with VWAP-Based Trades
VWAP and its bands can help define entries, but they don’t replace a risk management plan.
- Stop Placement: Place stops just beyond VWAP, the nearest standard deviation band, or the anchor point being used, depending on the setup.
- Dollar-Risk Position Sizing: Instead of relying on a fixed percentage rule, size each position around a specific dollar amount you’re comfortable risking on that trade, based on your account size and the contract’s tick value.
- Daily Loss Limits: Set a maximum dollar loss or a maximum number of losing trades per day. If VWAP reads keep failing in a single session, that’s often a sign the session doesn’t fit the setup you’re trying to trade.
Example Setup: A trader defines a maximum dollar risk per trade before the session starts. When entering a long position near VWAP on MES, the trader calculates the stop distance in ticks, multiplies by the contract’s tick value, and sizes the position so the total dollar risk matches that predetermined limit.
Pro Tip: Decide your dollar-risk limit before the session begins, not after you’re already in a trade. Adjusting risk mid-trade is one of the most common ways disciplined plans break down.
VWAP in Different Futures Markets
VWAP is not equally useful across all contracts. Its reliability depends heavily on volume and liquidity.
- Equity Index Futures: Highly liquid contracts like the E-mini S&P 500 (ES), Micro E-mini S&P 500 (MES), and Nasdaq (NQ/MNQ) are well-suited for VWAP and VWAP band strategies.
- Energy Futures: Crude oil (CL) and natural gas (NG) traders often use VWAP for intraday guidance because of heavy institutional involvement.
- Metals Futures: Gold (GC) and silver (SI) traders apply VWAP, along with anchored VWAP around economic releases, to gauge breakout potential.
- Agricultural Futures: Contracts like corn or soybeans are thinner in volume intraday, which can reduce VWAP’s effectiveness, though active traders still apply it.
Standard deviation bands are most reliable in the same high-liquidity contracts where plain VWAP performs best. In thinner markets, bands can widen or narrow unpredictably as a small number of large trades skew the volume data.
Common Mistakes When Using VWAP
While VWAP is a powerful tool, traders often make errors in applying it:
- Treating VWAP as a guaranteed support or resistance level.
- Ignoring the larger market trend or key news events.
- Relying only on VWAP without confirming with other indicators.
- Using VWAP in contracts with low liquidity, which can skew accuracy.
- Assuming a touch of a standard deviation band guarantees a reversal, rather than checking whether the session is trending or range-bound first.
- Confusing anchored VWAP with session VWAP when comparing charts, which can lead to misreading whether price is actually holding a level.
VWAP in Professional and Institutional Futures Trading
Large institutions often benchmark their order execution against VWAP. By doing so, they can measure whether their average price was better or worse than the market average.
Some institutional execution strategies are built specifically to fill large orders at or near the session VWAP, spreading trades out over the day rather than executing all at once. A related benchmark, TWAP (Time Weighted Average Price), spreads execution evenly across time instead of weighting by volume.
This matters for retail traders because price often gravitates around VWAP as institutions execute large orders. Understanding this behavior can help retail traders anticipate where the market may pause or reverse.
Limitations of VWAP in Futures Trading
Despite its strengths, VWAP has limits:
- Short-Term Focus: Because VWAP resets daily, it is less useful for multi-day swing trades.
- Liquidity Dependence: VWAP is less accurate in illiquid markets.
- Not a Standalone Tool: Traders should use VWAP alongside other analysis methods, such as chart patterns, support and resistance, or order flow.
How to Apply the VWAP Study on MetroTrader
MetroTrader makes it simple to apply VWAP on futures charts.
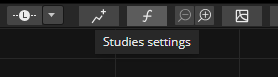
1. Select the Studies Option on Your Chart
You’ll find it in the top right corner of the chart widget.
2. Find Volume Weighted Average Price (VWAP)
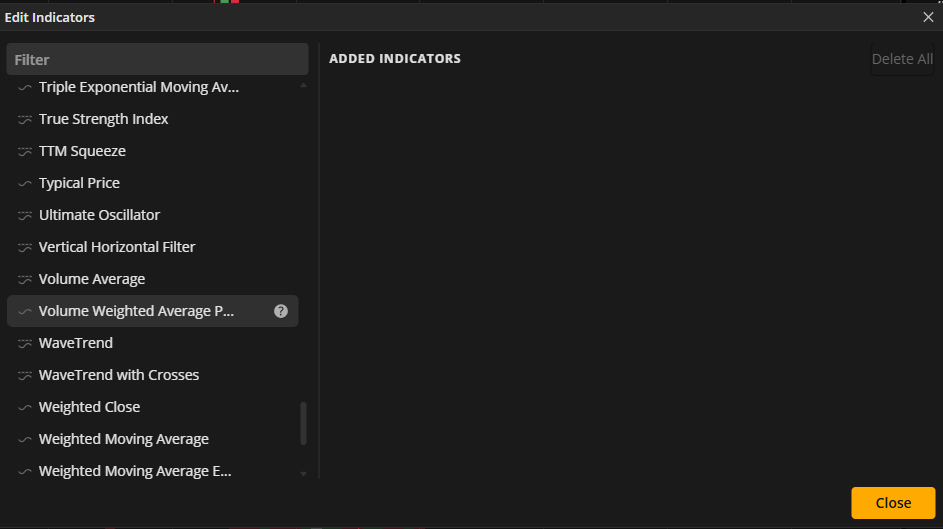
You can scroll through the many available study options or type to search.
3. Drag and Drop the Indicator
Simply drag and drop VWAP into the Added Indicators section. It will then automatically apply to the active chart widget.
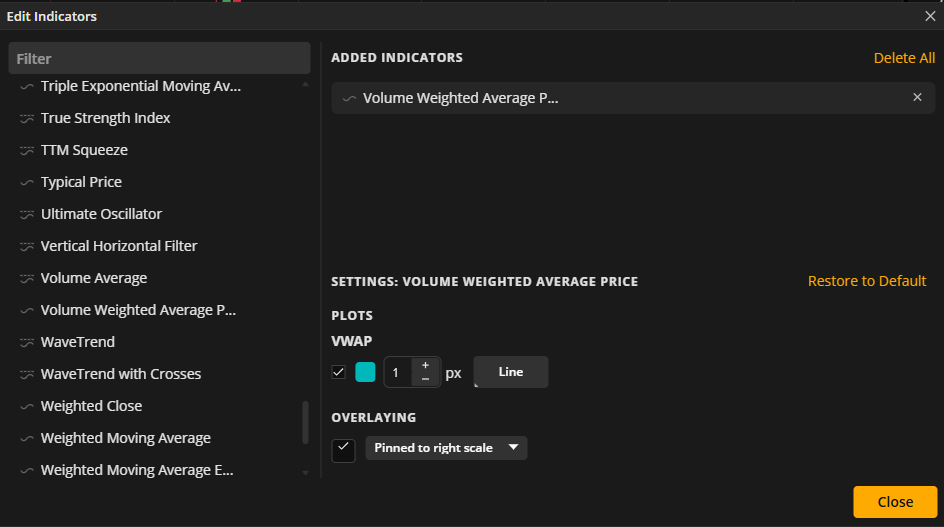
Once applied, VWAP appears as a single overlay line on the price chart, similar to a moving average. MetroTrader also displays the current VWAP value alongside the open, high, low, and close for the selected candle, so you can see the exact level at a glance without needing to hover over the chart.
Conclusion
VWAP is one of the most effective tools for analyzing intraday futures markets. By combining price and volume, it provides traders with an accurate view of fair value and helps confirm whether moves are supported by real activity.
Standard deviation bands, anchored VWAP, and disciplined dollar-risk sizing extend that single line into a fuller framework for reading a session and managing risk. At the same time, VWAP should not be used in isolation. Pairing it with other tools and a clear market read creates a stronger trading plan.
If you are new to VWAP, the best way to learn is by practicing. Open a MetroTrade account today to explore VWAP and other charting tools before trading live.
FAQs About VWAP
What is VWAP in futures trading?
VWAP stands for Volume Weighted Average Price. It shows the average price of a futures contract during the trading day, adjusted for volume. Traders use VWAP to find fair value levels and track intraday momentum.
How does VWAP work for futures contracts?
VWAP is calculated by dividing the total of price multiplied by volume by the total volume traded. In futures markets, VWAP updates throughout the day and resets with each new session, giving traders a real-time view of where most activity has occurred.
Is VWAP good for day trading futures?
Yes. VWAP is one of the most popular tools for day trading futures. It helps identify whether the market is bullish or bearish, confirms breakouts, and shows areas where price may act as support or resistance.
What is the difference between VWAP and moving averages in futures?
VWAP resets daily and includes trading volume in its calculation. Moving averages (SMA or EMA) only track price and continue across multiple days. VWAP is better for intraday trading, while moving averages can be used for both short-term and long-term analysis.
Can I use VWAP on all futures markets?
VWAP is most effective in highly liquid contracts such as equity index futures (ES, MES, NQ), energy futures (CL, NG), and metals futures (GC, SI). It is less reliable on thinly traded agricultural or niche contracts where volume is lower.
What is anchored VWAP in futures trading?
Anchored VWAP starts its calculation from a chosen point, such as a news release, contract rollover, or a major swing high or low, instead of the standard session open. Some traders call this “rolling VWAP,” though the underlying concept is the same.
What are VWAP standard deviation bands?
VWAP standard deviation bands are lines plotted above and below VWAP that measure how far price has statistically moved from the session average. Traders use them to spot overextended moves for mean reversion, or to confirm a strong trend when price holds along one band.
How do I add VWAP on MetroTrader?
In MetroTrader, VWAP is available as a built-in study. Open the Studies menu, select VWAP, and drag it onto your chart. It appears as a single line showing the running session average, which you can review in a demo account before trading live.
The content provided is for informational and educational purposes only and should not be considered trading, investment, tax, or legal advice. Futures trading involves substantial risk and is not suitable for every investor. Past performance is not indicative of future results. You should carefully consider whether trading is appropriate for your financial situation. Always consult with a licensed financial professional before making any trading decisions. MetroTrade is not liable for any losses or damages arising from the use of this content.