Momentum indicators play a big role in how traders make decisions, especially in fast-moving markets like futures. One of the most popular tools in this category is the RSI indicator, or Relative Strength Index.
Whether you’re day trading crude oil or swing trading equity index futures, the RSI can help you spot potential reversals, time entries more precisely, and avoid overextended trades. This article explains what the RSI indicator is, how it works, and how futures traders can apply it effectively.
Key Takeaways
- RSI (Relative Strength Index) is a momentum indicator that compares recent gains and losses to measure price strength.
- RSI helps traders identify overbought and oversold conditions, often signaling a potential reversal.
- In fast-paced futures markets, RSI can be especially helpful for timing short-term moves and avoiding emotional trades.
- RSI should be used with other tools like volume, support/resistance, or moving averages to confirm signals and reduce false positives.
What Is the RSI Indicator?

The RSI indicator was developed by J. Welles Wilder in 1978 and introduced in his book New Concepts in Technical Trading Systems. RSI is a momentum oscillator that compares the average of up periods to down periods over a set timeframe, often 14 periods by default.
The formula looks like this:
RSI = 100 – [100 ÷ (1 + RS)], where RS is the average gain divided by the average loss over the selected period.
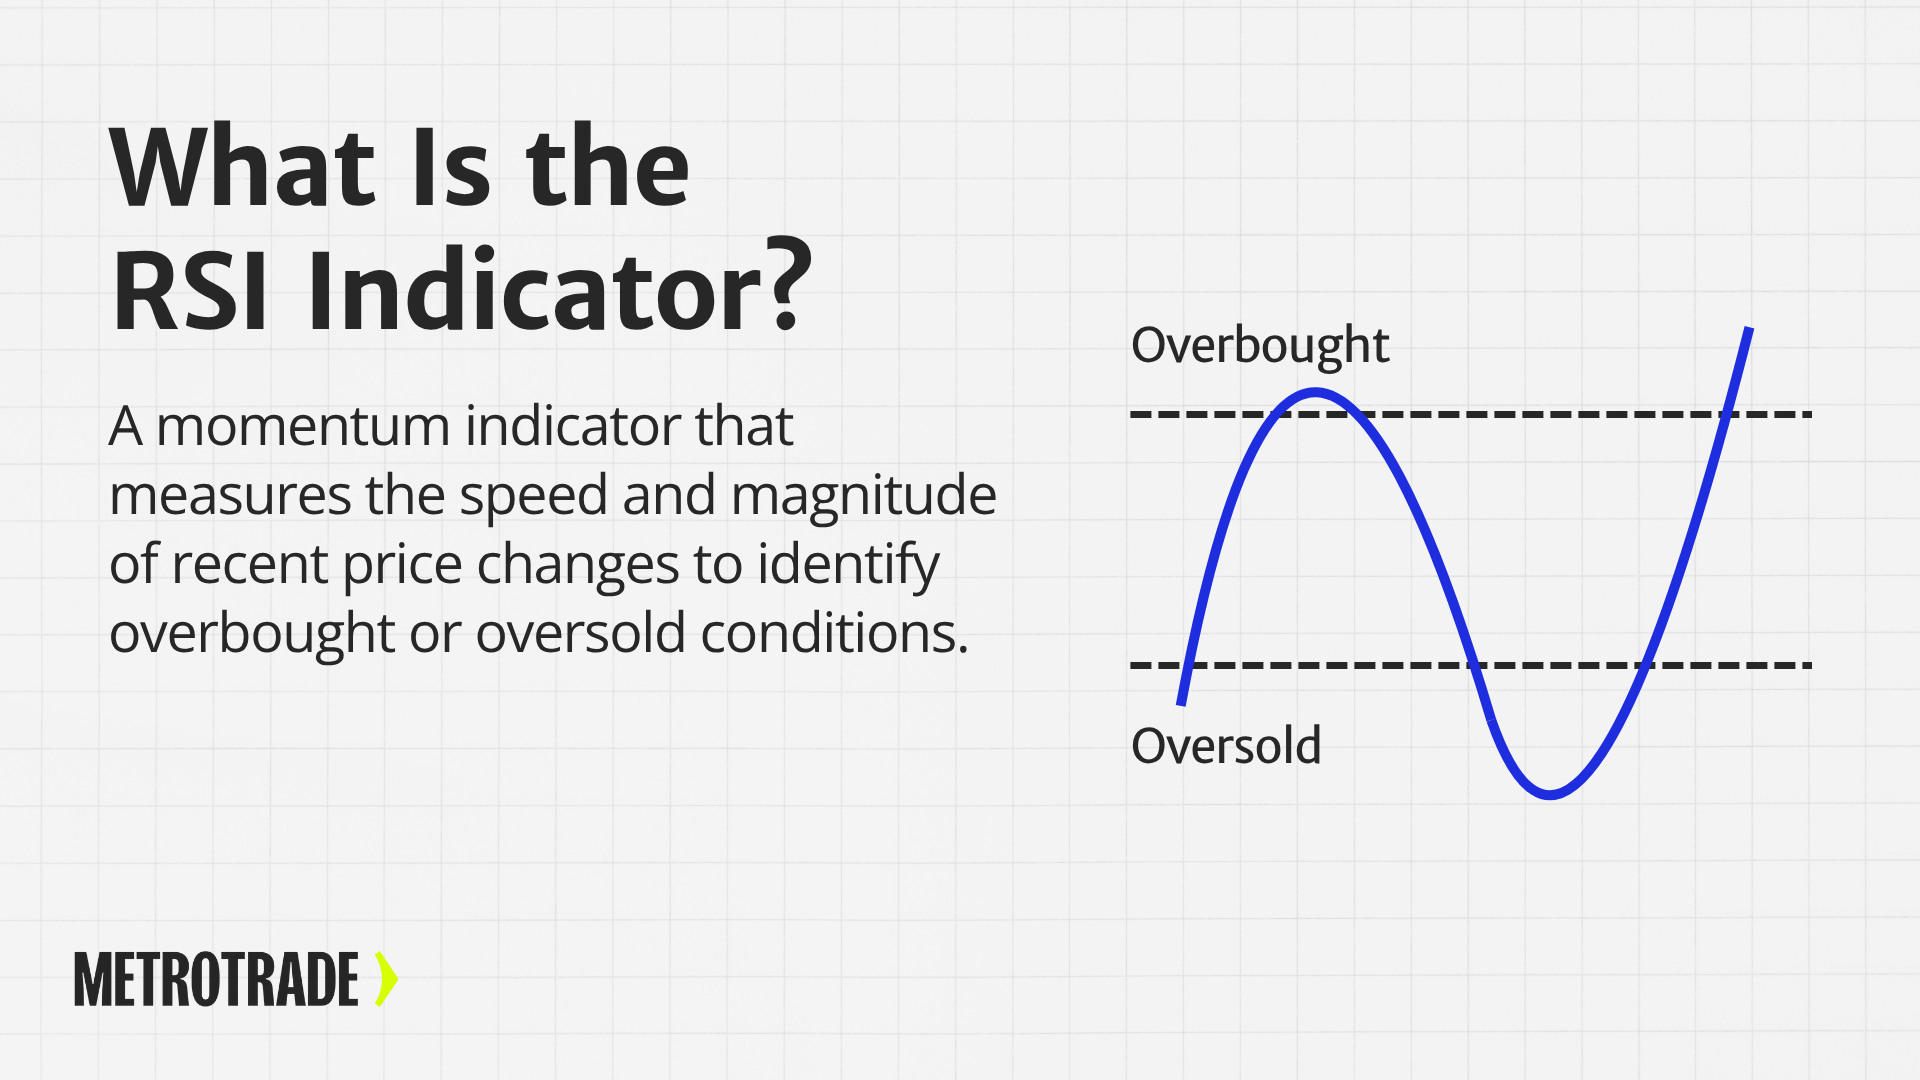
The result is a number between 0 and 100, which shows how strongly a contract has moved in one direction over that period. Traders use it to spot when price momentum may be slowing down, signaling a possible reversal or consolidation.
How the RSI Works: The Basics
Overbought Signals: RSI Above 70
When RSI rises above 70, it suggests that a futures contract may be overbought and due for a pullback. This doesn’t guarantee a reversal, but it often signals stretched bullish momentum.
Oversold Signals: RSI Below 30
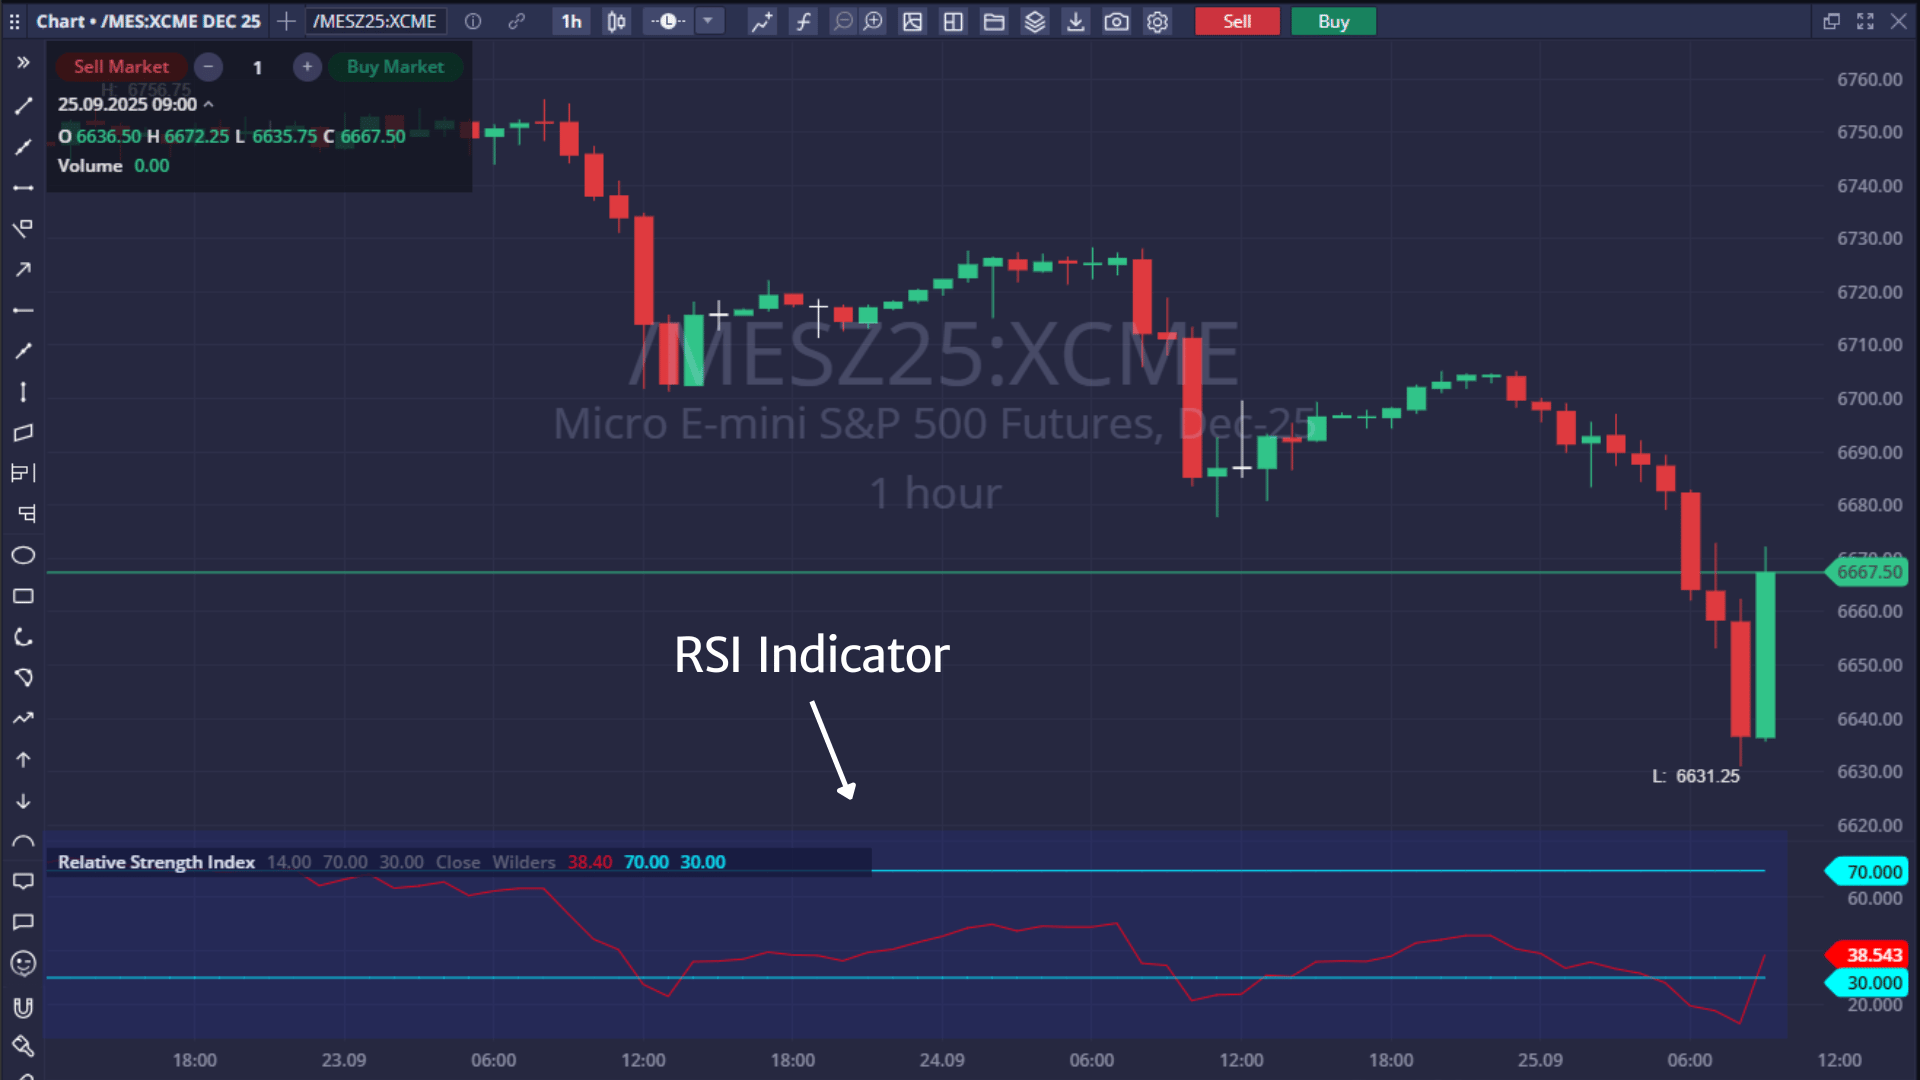
An RSI reading below 30 possibly indicates an oversold condition and a potential short-term bounce. Many traders use this level to look for early entry opportunities, especially near support.
Neutral and Sideways Zones Around 50
When RSI hovers near 50, the market is often range-bound or lacking strong directional momentum. Traders may use this zone to wait for confirmation before committing to a trade.
Divergence Signals: Price vs RSI
Divergence occurs when price moves in one direction while RSI moves in the opposite direction, hinting at weakening momentum. Bullish divergence suggests a potential bottom, while bearish divergence signals a possible top.
Example: RSI Rising While Price Stalls
If price moves sideways but RSI begins to climb, it may signal hidden strength and a potential breakout. Futures traders often use this as an early clue that sentiment is shifting.
Anatomy of the RSI Indicator on a Chart

RSI appears as a separate line chart below the price chart. It oscillates between 0 and 100 with clear levels marked at 30, 50, and 70. Here’s what to know about its chart behavior:
- Default Setting: 14-period RSI is the most common.
- Shorter Settings: 9-period or 5-period RSI offers faster signals but more noise.
- Longer Settings: 21-period or 30-period RSI filters out short-term spikes for smoother signals.
- Timeframes: RSI can be used on intraday, daily, and weekly charts, depending on your trading style.
Why Use RSI in Futures Trading?
Futures markets are fast, leveraged, and trend-prone, which makes RSI a valuable tool for many traders. Here’s why:
- Scalping & Day Trading: Use RSI to spot short-term overbought/oversold setups.
- Swing Trading: Find exhaustion at the end of a multi-day move.
- Avoid Chasing: RSI can keep you from entering too late when a trend is near reversal.
- Confirm Moves: Add confidence to your setups by using RSI with price action and volume.
Applying RSI in Futures Trading Strategies
- Oversold Entries: When RSI drops below 30 and starts turning upward, traders may interpret it as a signal that the selling pressure is easing. This can be an entry point for long positions, especially if the price is near a known support level.
- Overbought Exits: An RSI reading above 70 may suggest the current uptrend is overextended. Traders sometimes take partial profits or tighten stop-losses when RSI hits this zone.
- Divergence Signals: Bullish or bearish divergence between RSI and price can serve as an early warning of a potential reversal. This signal gains more weight when it aligns with key support or resistance areas.
- RSI + Support/Resistance: When RSI signals align with major price levels, they often carry more significance. For example, an oversold RSI bounce near a strong support zone may offer a higher-probability long setup.
- RSI + Moving Averages: Some traders combine RSI with moving average crossovers to confirm trend direction and entry timing. A bullish crossover paired with an RSI rebound can add conviction to a long trade.
- RSI Trendlines: Drawing trendlines directly on the RSI plot can reveal breakout setups before they appear on price charts. A break above an RSI downtrend line may precede a bullish price breakout.
Case Examples:
- Crude Oil Futures: RSI above 70 after a sharp rally may warn traders that the market is overheating. This can be a cue to tighten stops or scale out of long positions.
- E-mini S&P 500 Futures: When RSI drops below 30 during a market pullback, it may hint at a potential short-term bounce. Traders might look for a confirming candlestick pattern before entering.
- Gold Futures: If price consolidates but RSI starts climbing, it may signal bullish divergence. This setup can be useful for anticipating breakout trades in metals markets.
Common RSI Settings for Futures Traders
RSI is flexible. Here’s how futures traders tend to adjust their settings:
- 14-Period RSI (Default): Balanced for most swing traders and longer intraday trades.
- 5–9 Period RSI: Reacts faster; suited for scalping and quick setups.
- 21–30 Period RSI: Smoothes out noise for bigger-picture trades.
- Alternative Levels: Adjust 70/30 to 60/40 for volatile markets, or to tighten signals.
Strengths of the RSI Indicator
- Simple to understand: RSI is beginner-friendly and easy to interpret at a glance, even for newer futures traders.
- Works across contracts and timeframes: Traders can apply RSI to equity index, commodity, or currency futures on any chart interval.
- Highlights overbought and oversold levels: Helps traders spot when a market may be stretched and due for a reversal.
- Detects divergence: RSI can reveal hidden shifts in momentum that price action alone might not show.
- Complements other indicators: RSI works well when combined with tools like volume, moving averages, and trendlines.
- Supports discipline: By following RSI signals, traders can avoid chasing moves and reduce emotional decision-making.
Limitations of the RSI Indicator
No indicator is perfect. Here are some RSI drawbacks:
- Can produce false signals: In strong trends, RSI may remain overbought or oversold for extended periods without reversing.
- Lagging by nature: RSI is based on historical data, so it doesn’t predict future moves or guarantee precise timing.
- Not a standalone system: Relying on RSI alone without confirmation from other tools increases the risk of poor entries.
- Requires tuning: Different contracts and trading styles may need different RSI periods or levels for optimal use.
- Market context matters: RSI readings are less reliable in choppy or low-volume conditions where momentum is unclear.
- Doesn’t capture volume: Since RSI is price-based, it doesn’t factor in the strength of volume behind a move.
RSI vs MACD
Both RSI and MACD are momentum indicators, but they serve different purposes and work in different ways. Understanding how they contrast can help traders choose the right tool — or use both together for stronger confirmation.
The Relative Strength Index (RSI) focuses on overbought and oversold conditions. It gives traders a quick read on whether a market move may be losing steam and helps identify potential reversal zones. RSI works well in both trending and range-bound environments.
The Moving Average Convergence Divergence (MACD), on the other hand, is built from the relationship between two moving averages. It’s more commonly used to gauge trend direction and strength and is slightly slower to respond to price changes than RSI.
Key differences include:
- RSI is range-bound: It oscillates between 0 and 100, with overbought at 70 and oversold at 30. MACD is unbounded and instead focuses on crossovers and histogram movement.
- MACD is better for trend confirmation: It helps traders follow the broader trend rather than catching every minor pullback or bounce.
- RSI is better for timing entries: Its quicker reaction makes it useful for spotting potential turning points in shorter-term trades.
Many futures traders use both indicators together. For example, a trader might wait for a MACD bullish crossover, then look for RSI to rise above 50 before entering a long trade. This layered approach can reduce false signals and improve overall timing.
How to Use RSI on MetroTrader
Using RSI on MetroTrader is simple. Here’s how:
- Add Study: Click the “Studies” icon (ƒ) and search for Relative Strength Index.
- Customize Settings: Choose your preferred period (e.g., 14) and adjust levels if needed.
- Overlay Tools: Add moving averages or volume studies for signal confirmation.
- Chart Integration: Use RSI alongside candlestick charts, order flow, and price ladders on MetroTrader.
Real-World Examples of RSI in Futures Trading
Example 1: Bullish Divergence in E-mini S&P 500 Futures
- Price made lower lows over multiple sessions, signaling ongoing weakness.
- RSI began forming higher lows, creating a bullish divergence.
- Traders noticed momentum was improving despite bearish price action.
- A breakout above short-term resistance confirmed the reversal.
- Those watching RSI were positioned early for the upside move.
Example 2: Oversold Bounce in Gold Futures
- Gold futures dropped sharply after economic data, pushing RSI below 30.
- Price approached a previous support level, drawing attention from technical traders.
- RSI began to turn upward, signaling waning bearish momentum.
- A bullish candlestick pattern formed near support.
- Traders entered long positions and captured the rebound over the next few sessions.
Example 3: RSI Compression in Crude Oil Futures
- Crude oil traded sideways in a tight consolidation range.
- RSI hovered around 50, reflecting a lack of momentum.
- A closer look showed RSI forming a rising triangle pattern.
- RSI broke out of the triangle before price moved.
- Traders used the RSI breakout as an early signal to enter ahead of the bullish move.
Risk Management with RSI
Using RSI effectively isn’t just about spotting signals; it’s also about knowing when not to act. Like any technical indicator, RSI can generate false positives, especially in fast-moving or strongly trending markets. That’s why risk management is essential.
- Don’t trade RSI in isolation: An RSI reading below 30 or above 70 doesn’t guarantee a reversal. Always wait for confirmation from price action, volume, or other technical indicators before entering a trade.
- Use stop-losses based on structure: Place stops around recent swing highs or lows instead of relying solely on RSI signals. This protects your position in case momentum fails to follow through.
- Size positions according to volatility: Adjust your contract size based on how volatile the market is and how confident you are in the setup. High-volatility futures like crude oil may need wider stops than micro equity index futures.
- Treat RSI as a filter, not a trigger: Some traders only take long trades when RSI is above 50 or short trades when it’s below 50. This approach helps you stay aligned with the prevailing trend and avoid countertrend setups.
Common Mistakes Futures Traders Make with RSI
While RSI is a valuable momentum tool, it’s not foolproof. Many traders misuse it by over-relying on signals or ignoring key factors like volatility and market structure. Avoiding these common mistakes can help you get more consistent results.
- Assuming RSI guarantees reversals: Just because RSI hits overbought or oversold levels doesn’t mean the market will immediately reverse. In strong trends, RSI can stay extreme for long periods.
- Ignoring market context: RSI readings mean different things in trending vs range-bound environments. Failing to consider the broader price structure can lead to poor decisions.
- Over-optimizing RSI settings: Tweaking RSI periods to fit past performance can lead to unreliable results in live markets. Stick with proven settings and focus on real-time confirmation.
- Trading without accounting for volatility: Using the same RSI levels across all contracts ignores how differently they behave. A 30 RSI in natural gas may not carry the same weight as in the E-mini S&P 500.
Being aware of these pitfalls and using RSI as part of a broader trading plan can improve both your timing and your confidence in futures markets.
Best Futures Contracts to Apply RSI
Some contracts respond especially well to RSI setups:
- Equity Index Futures: E-mini and Micro E-mini S&P/Nasdaq contracts offer strong trends and high liquidity.
- Crude Oil Futures: Known for explosive moves; RSI can help time entries and exits.
- Gold & Metals Futures: RSI divergence often appears before price reversals.
- Micro Contracts: Excellent for testing RSI strategies without large capital exposure.
Conclusion
The RSI indicator is a versatile and beginner-friendly tool that helps futures traders understand momentum, avoid bad entries, and stay disciplined during volatile moves. While it’s not foolproof, pairing RSI with other confirmation signals can improve your decision-making and risk management.
Ready to put RSI into practice?
Open a MetroTrader account today and explore futures strategies using professional-grade tools and real-time indicators.
FAQs About the RSI Indicator
What is the RSI indicator in simple terms?
The RSI (Relative Strength Index) is a momentum indicator that measures how fast and how far prices have moved in recent periods. It helps traders identify when a futures contract may be overbought or oversold.
How does the RSI indicator work in futures trading?
RSI compares recent gains and losses to show if a market is gaining or losing momentum. Traders use it to spot potential reversals or confirm trends in futures contracts.
What RSI setting works best for futures trading?
The standard 14-period RSI is widely used in futures trading. However, shorter settings like 5 or 9 work well for scalping, while longer settings like 21 or 30 are better for swing trades.
Is the RSI indicator good for day trading futures?
Yes, RSI can be useful for day trading futures by helping identify short-term overbought and oversold conditions. Many traders use RSI on intraday charts to time entries and exits.
Can you use RSI for swing trading futures?
RSI works well for swing trading futures because it highlights momentum shifts over several days. Swing traders often use RSI to spot exhaustion in strong up or down moves.
What’s the difference between RSI and MACD?
RSI shows when a market is overbought or oversold, while MACD focuses on trend direction using moving average crossovers. RSI is more reactive; MACD is better for confirming longer-term momentum.
How do traders confirm RSI signals?
Traders confirm RSI signals using price action, support and resistance levels, volume, or other technical indicators. Confirmation helps reduce false signals and improves trade timing.
What are the risks of using RSI in futures trading?
The biggest risk is relying on RSI alone without context. RSI can give false signals during strong trends, so it’s important to use stop-losses and confirm setups with other tools.
The content provided is for informational and educational purposes only and should not be considered trading, investment, tax, or legal advice. Futures trading involves substantial risk and is not suitable for every investor. Past performance is not indicative of future results. You should carefully consider whether trading is appropriate for your financial situation. Always consult with a licensed financial professional before making any trading decisions. MetroTrade is not liable for any losses or damages arising from the use of this content.


