The precipitously downward market move on October 10th, combined with the year-long rally in gold and silver, got me thinking about manias, panics, and crashes, the role of October in that narrative, and their place in the derivatives industry.
October has long held a special place in the collective consciousness of financial market participants (known as the October Effect) —a month when the ghosts of crashes past seem to whisper warnings through trading floors and across electronic platforms. From the Panic of 1907 to Black Monday in 1987, October has witnessed some of the most dramatic market collapses in history. But is this reputation deserved, or is it simply a case of selective memory amplified by market folklore?
Manias: a short history of gold and silver
As of today, gold and silver prices are up roughly 60% year over year. Historically, since 1971, gold has averaged an annual price increase of 7.8% per year, and silver 5.9% per year.
There are legitimate reasons why gold has rallied significantly this year, namely:
- Expectation of rate cuts
- USD weakening
- Macro risk
- Central bank/reserve accumulation
But in my mind, a rally of 60% smells of a mania, particularly in the case of silver. It’s only a matter of time before ‘cash for gold & silver’ signs start cropping up in suburban strip malls and millennials start combing through grandma and grandpa’s closets looking for unloved heirlooms to sell.
Historically, we are not yet in the range of gold and silver moves of the 1970s and early 1980s, but it bears watching. Specifically, there are two historic events that could impact how gold and silver prices move going into 2026:
The Gold Rush:
When the US went off the gold standard in 1971, it created a years-long bull market in gold that ultimately resulted in a 2300% increase in gold prices from 1970 to 1980. This was the result of similar concerns playing out today:
- Artificially low interest rates (ultimately resulting in double-digit inflation)
- Loss of confidence in fiat currencies
- Macro risk – the Yom Kippur war, the resulting oil shocks, and the Iranian revolution
The bubble for gold ultimately burst when the Federal Reserve, led by Paul Volcker, dramatically raised interest rates to bring down inflation, ultimately resulting in a two-decade bear market for gold.
The Hunt corner and Silver Thursday:
Throughout the 1970s, the Hunt brothers quietly accumulated silver through outright spot purchases and taking physical delivery of futures contracts. This buying reached a climax during the 1st quarter of 1980, with the price of silver rising from $6 per ounce to $50 per ounce, with the Hunts owning an estimated ⅓ of the entire world’s silver supply outside of central banks and governments.
As a result of this attempted corner, COMEX adopted new rules that heavily restricted the purchasing of silver futures on margin. When prices began to inevitably fall without the ability of the Hunts to prop up the price with more purchases on margin, the brothers were issued a margin call for $100 million, which they could not meet. Given the size of their exposure to their clearing firm and fearing a general market collapse, a consortium of banks stepped in and provided a billion-dollar line of credit to the Hunts to allow them and their clearing firm to survive and minimize the overall market damage.
As a result of this, by 1982, silver was trading at roughly $5 per ounce, a price that remained somewhat constant for the next two decades.
Panics & Crashes: The October Effect
The October Effect’s notoriety stems from a series of catastrophic market events that occurred during this particular month. The Panic of 1907 began on October 22nd when the Knickerbocker Trust Company collapsed, triggering a financial crisis that required J.P. Morgan himself to orchestrate a private bailout of the banking system. This event was so severe that it eventually led to the creation of the Federal Reserve in 1913.
Twenty-two years later, October 1929 brought us Black Thursday (October 24th) and Black Tuesday (October 29th), marking the beginning of the Great Depression. The Dow Jones Industrial Average lost nearly 25% of its value in just two days, wiping out billions in wealth and ushering in a decade of economic hardship. These events became seared into the American psyche, creating a generational trauma around October and the stock market.
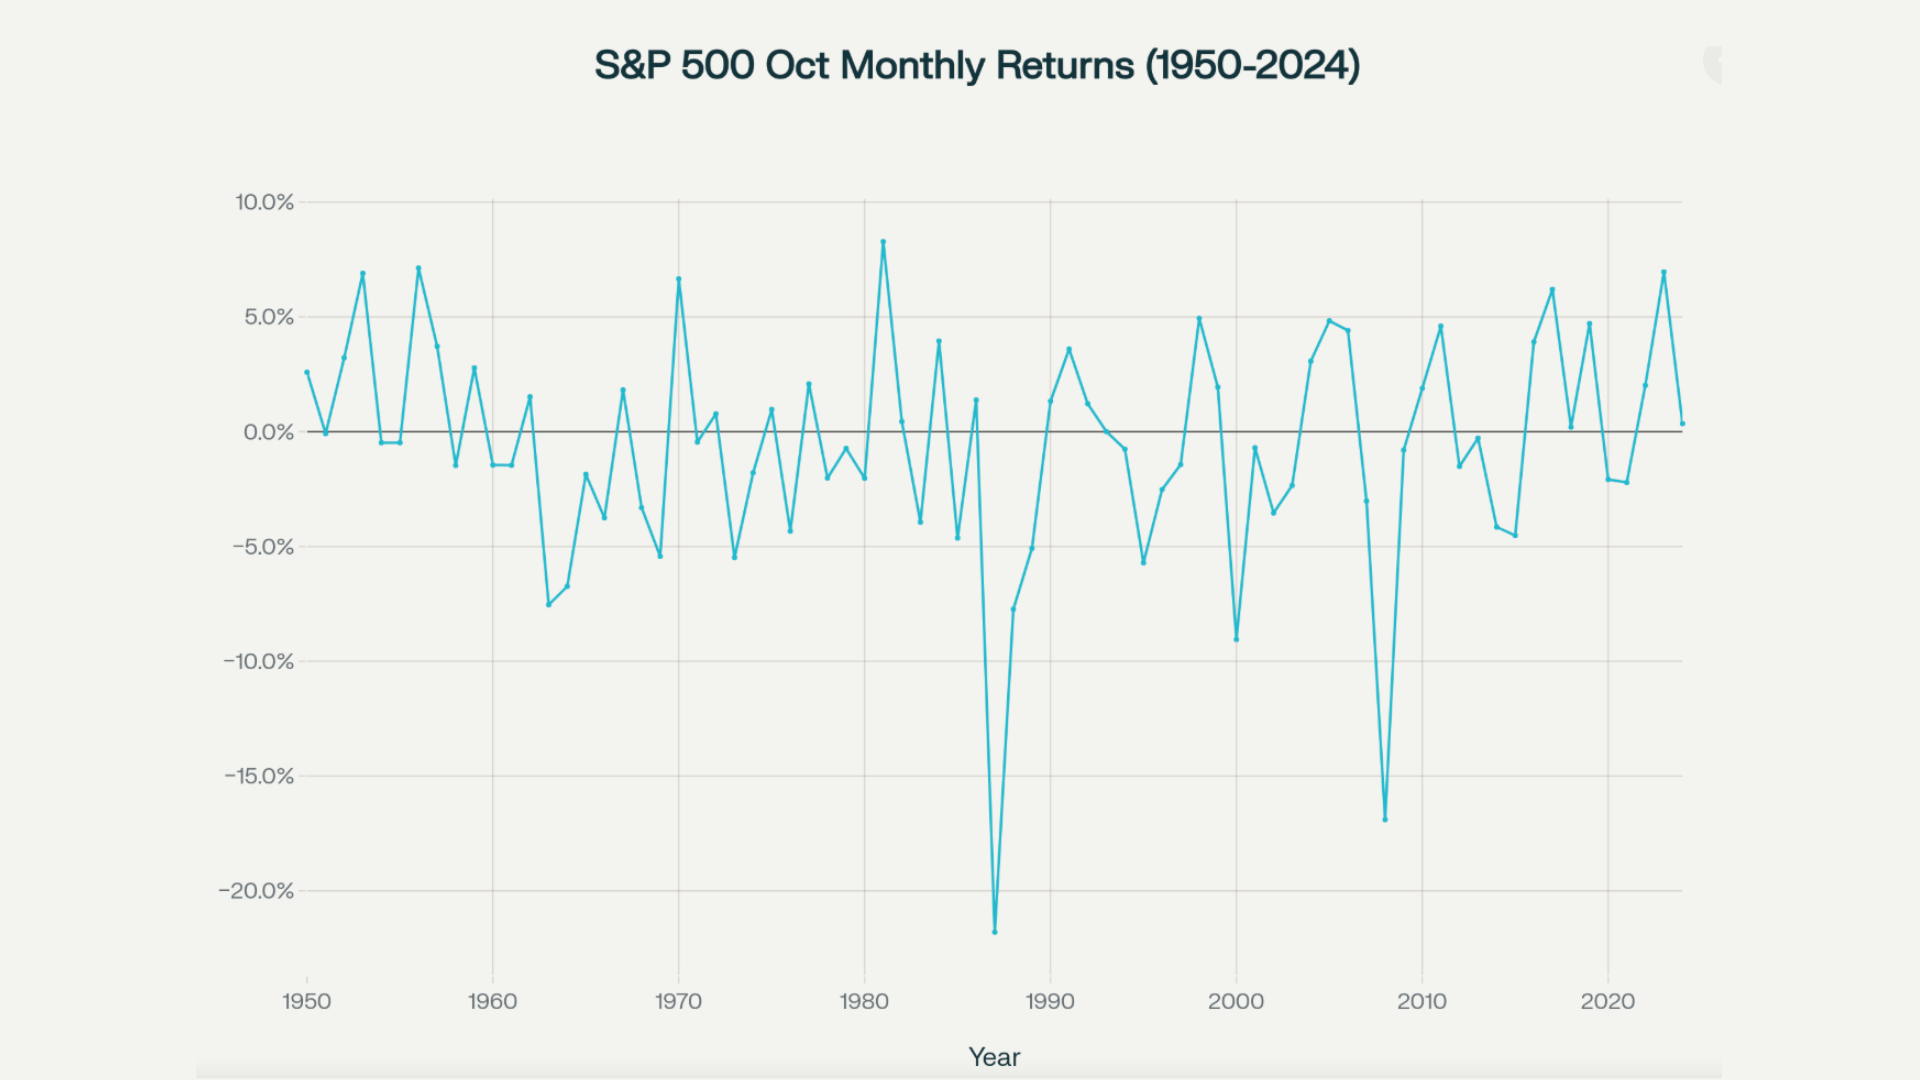
More recently, Black Monday on October 19, 1987, saw the Dow plunge 22.6% in a single day—still the largest one-day percentage decline in stock market history. The crash was so severe that it prompted exchanges worldwide to implement circuit breakers designed to halt trading during extreme volatility. The fact that this modern catastrophe also occurred in October only reinforced the month’s ominous reputation.
Panics & Crashes: The Statistical Reality
Despite October’s fearsome reputation, statistical analysis tells a more nuanced story. Academic studies examining market returns over the past century have found that October, on average, doesn’t actually produce worse returns than other months. In fact, September has historically been the worst-performing month for stocks, with more frequent declines than October.
What October does have is higher volatility. The dramatic swings—both up and down—tend to be more pronounced during this month. This volatility, rather than consistent negative returns, is what creates the psychological impact. Traders and investors remember the spectacular crashes more vividly than the steady gains that have often occurred during October as well.
Since 1950, October has actually posted positive returns more often than negative ones for the S&P 500. Several Octobers have marked the beginning of significant bull market rallies, including the recovery that started in October 2002 following the dot-com bust, and the powerful rally that began in October 2008 during the financial crisis. The problem is, the negative returns that do occur in October historically are of greater magnitude to the markets than the more numerous gains, as evidenced by this chart:

Panics & Crashes: Why October Might Be Different
While the October Effect may be more psychological than statistical, several structural factors could contribute to increased market stress during this time of year:
Fiscal Year-End Positioning: Many corporations and investment funds operate on fiscal years that end in September or December. October represents a period of transition and portfolio rebalancing, which can increase trading activity and volatility.
Summer Liquidity Drain: The old Wall Street adage “sell in May and go away” reflects the reality that many traders and institutional investors take extended vacations during summer months. As they return in September and October, increased participation can lead to more volatile price discovery as the market digests news and events that accumulated during the quieter summer period.
Quarterly Earnings Season: October typically falls within the third-quarter earnings reporting period. As companies report their results and provide guidance for the remainder of the year, market participants reassess valuations and adjust positions accordingly.
Leverage and Margin: After a typically strong summer rally (when it occurs), portfolios may be carrying higher levels of leverage by October. When volatility spikes, forced liquidations from margin calls can accelerate downward moves, creating the kind of dramatic crashes that October has become known for.
The Self-Fulfilling Prophecy
Perhaps the most interesting aspect of the October Effect is the role that psychology and self-fulfilling prophecies play in perpetuating it. Because traders and investors are aware of October’s reputation, they may approach the month with heightened caution and quicker trigger fingers. This defensive positioning can actually contribute to increased volatility.
When markets begin to decline in October, the historical precedent of past crashes can amplify fear and accelerate selling. Traders who might hold through a similar decline in March may be quicker to exit positions in October, simply because the month’s reputation creates additional psychological pressure. Media coverage tends to emphasize the October connection during any market weakness, further reinforcing the narrative.
This creates a feedback loop where belief in the October Effect can contribute to volatility that then validates the belief, regardless of whether there’s any fundamental basis for it.
Conclusion
The current rally in precious metals serves as a reminder that markets can remain irrational far longer than conventional wisdom suggests. Whether today’s gold and silver prices represent a justified response to macroeconomic uncertainty or the early stages of a speculative mania remains to be seen. What is certain is that derivative markets—through futures and options—provide essential tools for both hedgers seeking protection and speculators willing to assume risk.
The October Effect, whether rooted in statistical reality or psychological perception, offers valuable lessons for today’s market participants. History teaches us that manias, panics, and crashes are not relics of the past but recurring features of financial markets driven by the timeless interplay of fear and greed.
For traders and investors, the key takeaway is simple: prepare for volatility not because the calendar says October, but because markets are inherently unpredictable. Whether trading gold, silver, equity indices, or any other derivative contract, robust risk management, appropriate position sizing, and an understanding of market history remain your best defenses against whatever surprises the markets may deliver—in October or any other month.
Sources:
https://goldprice.org/
https://www.ice.com/iba/lbma-gold-silver-price
https://www.federalreservehistory.org/essays/anti-inflation-measures
https://en.wikipedia.org/wiki/Silver_Thursday
https://en.wikipedia.org/wiki/Panic_of_1907
https://en.wikipedia.org/wiki/Wall_Street_crash_of_1929
https://en.wikipedia.org/wiki/Black_Monday_(1987)


