Futures trading can move fast. With market volatility and short-term price swings, traders need tools to help spot momentum shifts and potential trade setups. That’s where technical indicators come in—and one of the most popular is the MACD indicator.
MACD stands for Moving Average Convergence Divergence. It’s a simple, powerful momentum indicator that helps futures traders track trend direction and time potential entries and exits. In this guide, we’ll break down exactly how the MACD works, how to use it in futures markets, and some of the best strategies for putting it into action.
Key Takeaways
- The MACD indicator helps futures traders spot momentum shifts and trend direction. It uses two exponential moving averages and a signal line to show when momentum is building or fading.
- MACD crossover signals can highlight potential entry and exit points. Bullish and bearish crossovers between the MACD line and signal line often signal short-term trend reversals or continuations.
- MACD works best when combined with other tools and proper risk management. While it’s useful on its own, pairing MACD with volume analysis, support/resistance, or RSI improves reliability.
- Traders can apply MACD to any liquid futures contract across multiple timeframes. Whether you trade the E-mini S&P 500 or crude oil, MACD can help analyze trends on intraday, swing, or position setups.
What Is the MACD Indicator?

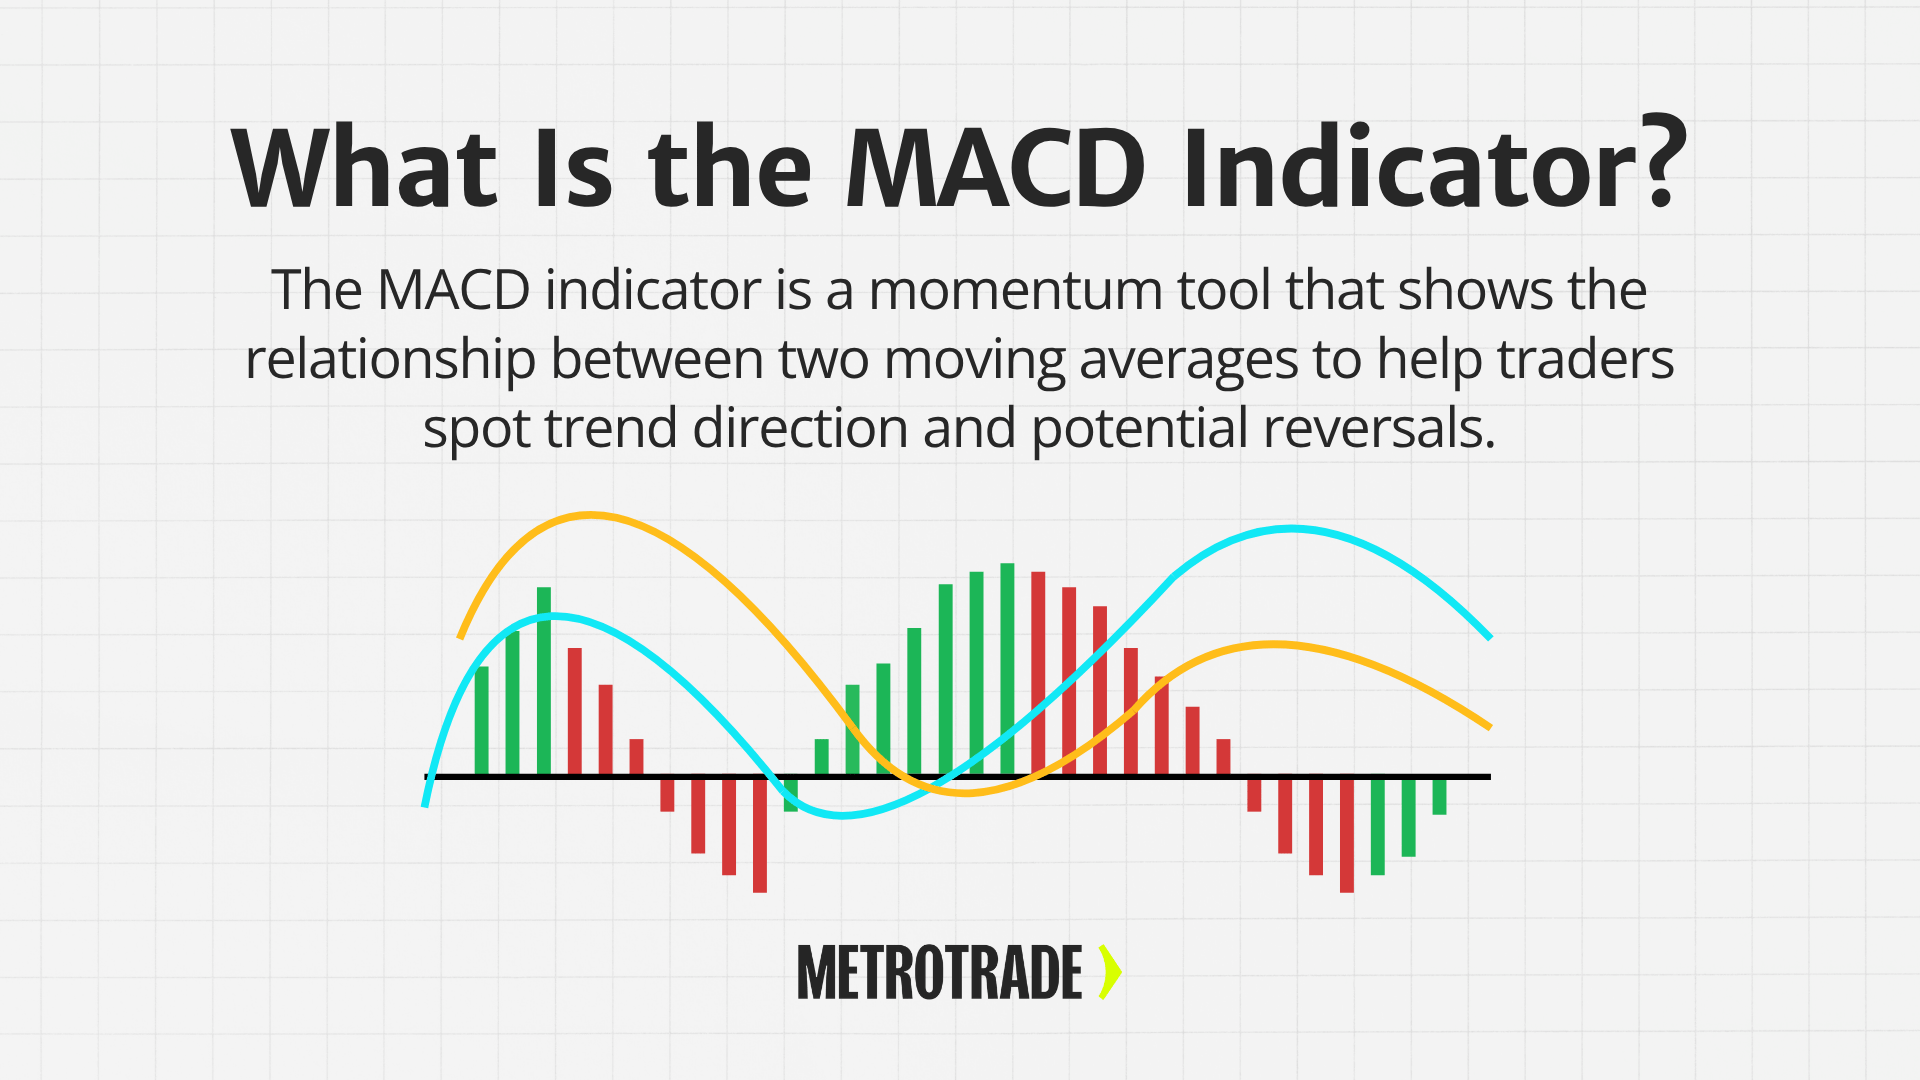
The MACD indicator is a momentum-based technical indicator that tracks the relationship between two moving averages of price. It’s designed to help traders identify trend direction, strength, and potential reversals.
Originally developed by Gerald Appel in the 1970s, MACD remains one of the most widely used tools across markets, from stocks and forex to commodities and futures.
Futures traders use MACD to answer questions like:
- Is the trend gaining or losing momentum?
- Are we approaching a potential bullish or bearish crossover?
- Is price action diverging from the indicator?
MACD is part of many popular trading platforms, including MetroTrader, where you can apply it to contracts like the S&P 500 E-mini (ES), crude oil (CL), gold (GC), and more.
How the MACD Indicator Is Calculated
The MACD is built from moving averages, which are lagging indicators based on past price data. What makes the MACD unique is how it uses two different exponential moving averages (EMAs) to measure both momentum and trend strength. These EMAs respond more quickly to price changes than simple moving averages, making the MACD more responsive in fast-moving futures markets.
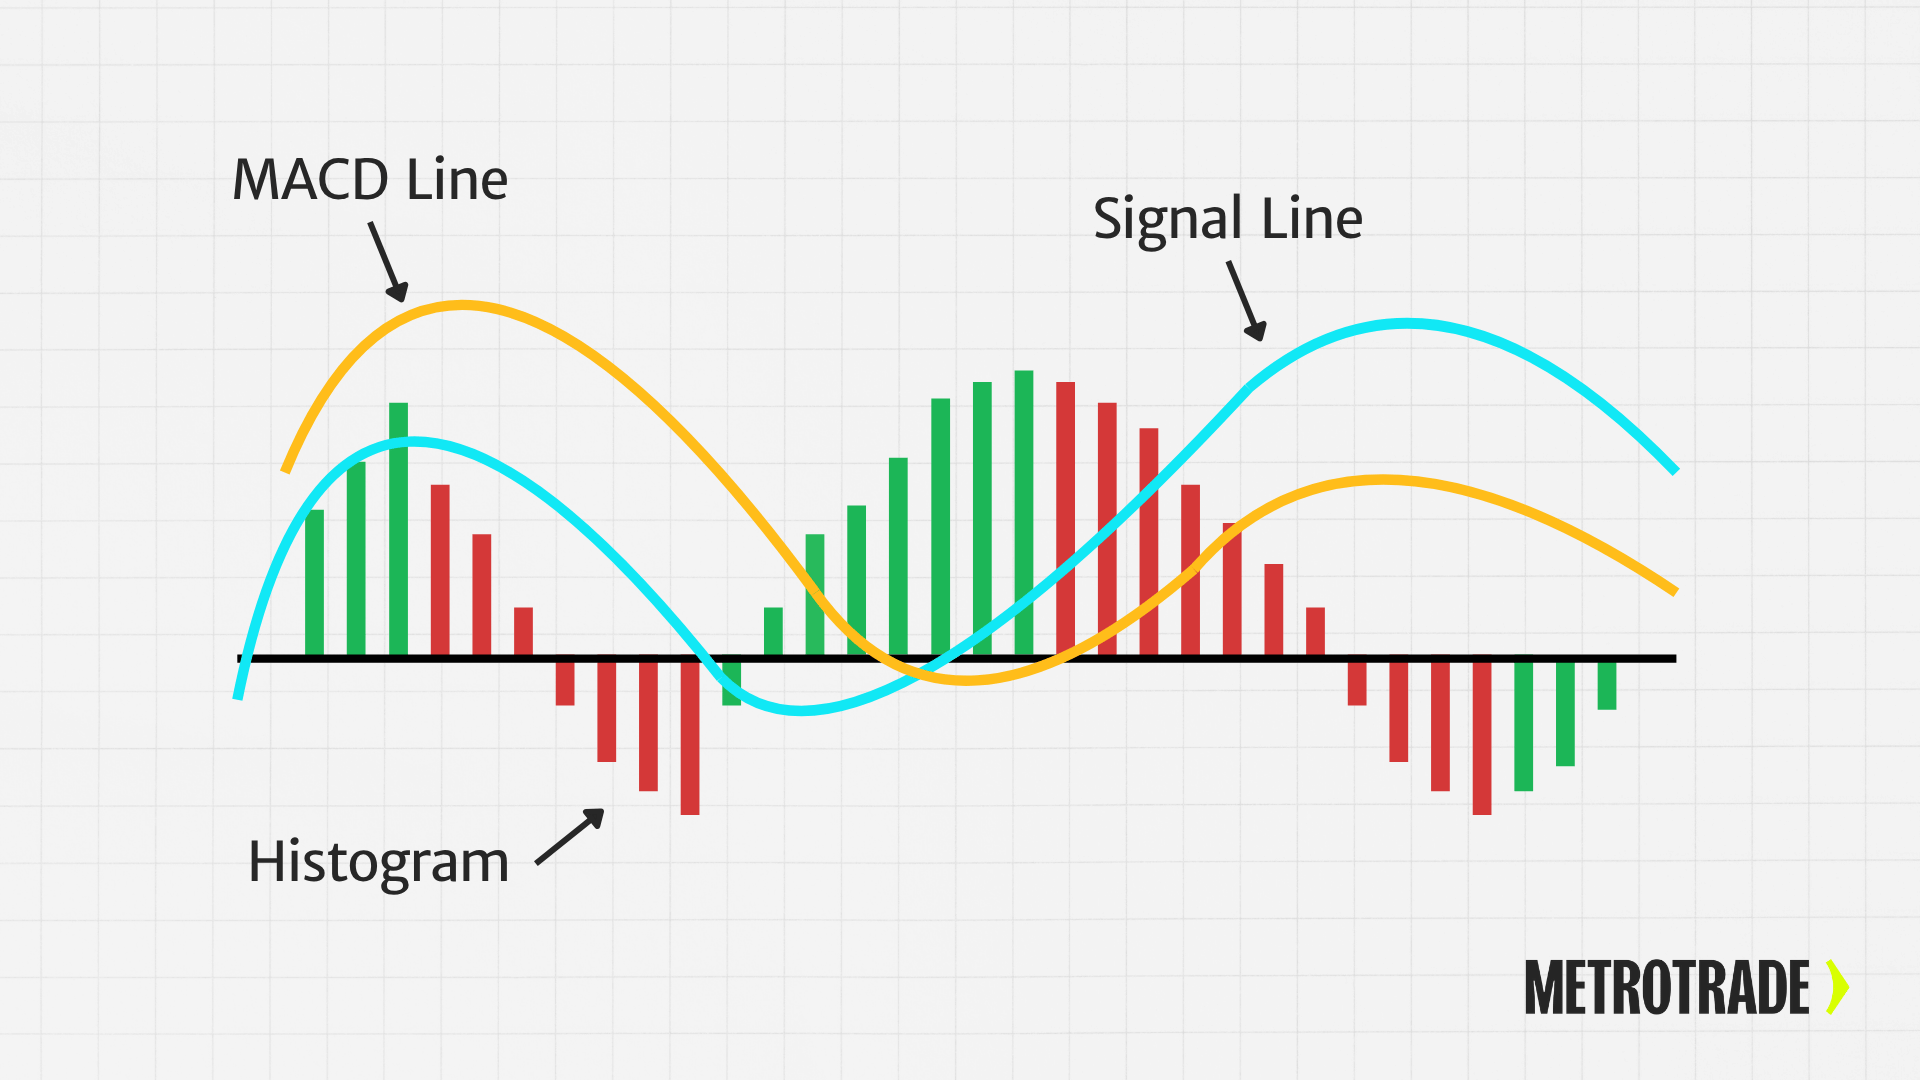
The calculation involves three main components:
MACD Line
This is the heart of the indicator. It’s calculated by subtracting the 26-period EMA from the 12-period EMA:
MACD Line = 12-period EMA – 26-period EMA
A positive MACD line means the shorter-term trend is moving faster than the longer-term trend (bullish momentum). A negative line shows weakening momentum or bearish pressure.
Signal Line
This is a 9-period EMA of the MACD line. It serves as a trigger for buy or sell signals. When the MACD line crosses above the signal line, it’s often interpreted as a bullish signal. When it crosses below, it may indicate a bearish trend.
Histogram
The histogram visualizes the distance between the MACD line and the signal line.
Histogram = MACD Line – Signal Line
When the histogram grows, momentum is increasing. When it shrinks or flips direction, momentum is slowing or possibly reversing.
Here’s a simplified numerical example:
- 12-period EMA: 4200
- 26-period EMA: 4185
- MACD Line = 4200 – 4185 = +15
- Signal Line (9-period EMA of MACD): 13
- Histogram = 15 – 13 = +2
In this case, the positive MACD line and histogram suggest bullish momentum is increasing. As prices update, these values change and give traders a running view of the market’s momentum.
Traders can modify the MACD settings based on their strategy or the volatility of a specific futures contract. For instance, some scalpers prefer faster settings (like 6, 13, 5), while swing traders often stick with the standard 12, 26, 9.
What Each MACD Component Means
Let’s break down each part of the MACD to better understand how it works.

MACD Line
- This line represents the short-term trend compared to the longer-term trend.
- A rising MACD line suggests increasing bullish momentum.
- A falling line shows increasing bearish momentum.
Signal Line
- The signal line acts as a trigger for buy or sell signals.
- When the MACD line crosses above it, it’s often considered a bullish signal.
- When it crosses below, it’s seen as bearish.
Histogram
- The histogram displays the distance between the MACD and signal line.
- Taller bars = stronger momentum.
- When the histogram shrinks or flips direction, it may signal a potential trend reversal.
How to Read MACD Signals
Once you understand how the MACD is built, the next step is learning how to interpret its signals on a chart. The MACD indicator is popular because it generates clear, visual cues that traders can use to time potential entries and exits.
There are three main types of MACD signals that futures traders watch for: crossover signals, zero line signals, and divergence signals. Each provides different insights into market behavior.
1. MACD and Signal Line Crossovers
This is the most common way traders use MACD. A crossover occurs when the MACD line moves through the signal line. These crossovers can signal a possible shift in momentum:
- Bullish crossover:
When the MACD line crosses above the signal line, it suggests that upward momentum is increasing. This is often a potential buy signal, especially if it happens below the zero line and the histogram starts to turn positive. - Bearish crossover:
When the MACD line crosses below the signal line, it points to growing bearish momentum. This is typically seen as a sell signal, especially if it happens above the zero line and the histogram flips negative.
Crossover signals are more reliable when confirmed by other technical factors – like trendlines, support/resistance levels, or rising/falling volume.
2. Zero Line Crossovers
The MACD line can also cross the zero line, which represents the point where the 12-period and 26-period EMAs are equal.
- Crossing above zero:
When the MACD line moves from below to above zero, it confirms that short-term momentum has overtaken long-term momentum. This often signals the start of a new bullish trend. - Crossing below zero:
When the MACD line drops below the zero line, it means short-term momentum has weakened below the long-term trend. This can suggest the start of a new bearish trend.
Many traders use zero line crossovers as trend confirmation, especially on longer timeframes like the daily or weekly chart. They often combine them with price patterns or moving average crossovers for additional confirmation.
3. Divergence Between MACD and Price
Divergence happens when the MACD indicator moves in the opposite direction from the price. This can be an early warning that the current trend is losing strength and may reverse.
- Bullish divergence:
Price makes a lower low, but the MACD makes a higher low. This suggests that the downtrend is weakening and could reverse upward. - Bearish divergence:
Price makes a higher high, but the MACD makes a lower high. This indicates that the uptrend may be losing steam, and a reversal to the downside could be near.
Divergence is often used by swing traders and position traders looking for early reversal setups. However, these signals are not always immediate, so traders often use them alongside candlestick patterns or other indicators like RSI.
Interpreting the MACD Histogram
While the MACD line and signal line provide crossovers, the histogram offers a visual sense of momentum strength:
- Expanding histogram bars:
When the bars get taller (either positive or negative), it shows momentum is accelerating in that direction. - Shrinking histogram bars:
When the bars get shorter, it signals that momentum is slowing. If followed by a crossover, it may signal a trend change.
Traders often monitor the histogram for early signs of fading momentum, which can help them prepare for a possible exit or reversal.
Tip: Cross-reference MACD signals with contract-specific context. For example, on volatile contracts like crude oil (CL) or Nasdaq futures (NQ), signals can appear frequently and may need additional confirmation.
Using MACD for Futures Trading
The MACD is especially helpful for futures traders who rely on momentum and trend direction to time entries. It works well across several contract types, including:
- Equity index futures (like ES and NQ)
- Energy futures (like CL and NG)
- Metal futures (like GC and SI)
- Currency futures (like 6E and 6J)
Ideal Timeframes for Futures
- Intraday trading: 5-minute or 15-minute charts
- Swing trading: 1-hour to daily charts
- Position trading: Daily to weekly charts
MACD gives a clean signal in trending markets but can be less reliable during sideways consolidation. That’s why it pairs best with other tools like support/resistance zones, trendlines, and volume.
Common MACD Trading Strategies in Futures
The MACD isn’t just a tool for analyzing charts. It’s also a core part of many trading strategies used by both beginners and experienced futures traders. Below are four of the most common ways to apply MACD in futures trading. Each strategy can be adapted for different markets and timeframes, from short-term index futures to longer-term commodity trends.
These strategies work best when combined with sound risk management, chart patterns, or other indicators like volume or RSI.
1. MACD Signal Line Crossover Strategy
This is the most widely used MACD strategy. It focuses on the crossover between the MACD line and the signal line.
- How it works:
A buy signal is generated when the MACD line crosses above the signal line.
A sell signal is triggered when the MACD line crosses below the signal line. - When to use:
This strategy is most effective in trending markets, such as when futures prices are steadily moving up or down. Traders often wait for confirmation from the histogram (turning positive or negative) before entering. - Example:
In the E-mini S&P 500 (ES), a bullish crossover on the 15-minute chart during an uptrend might signal a short-term buy opportunity.
2. MACD Zero Line Crossover Strategy
This strategy looks at when the MACD line crosses the zero line itself, not the signal line.
- How it works:
A bullish signal is given when the MACD line crosses above the zero line, showing upward momentum.
A bearish signal occurs when it crosses below, indicating a potential downtrend. - When to use:
Zero line crossovers can help confirm the start of a new trend. Traders often use this to stay on the right side of the market and avoid fighting momentum. - Example:
On a 4-hour chart of crude oil (CL), a move above the zero line during rising prices may signal a new leg higher in the trend.
3. MACD + RSI Confirmation Strategy
MACD is often paired with the Relative Strength Index (RSI) to create a more reliable entry system. RSI shows whether a market is overbought or oversold, helping traders filter MACD signals.
- How it works:
Use MACD to spot a crossover or zero line move, then check RSI to confirm: - A bullish MACD crossover + RSI rising from oversold = potential long setup
- A bearish MACD crossover + RSI falling from overbought = potential short setup
- When to use:
This combo works well in both trending and range-bound markets. It helps reduce false signals by waiting for agreement between indicators. - Example:
On a daily gold futures (GC) chart, a MACD crossover with RSI rising from 30 to 40 may confirm a swing trade entry.
4. MACD Divergence Strategy
Divergence between price and the MACD can signal that the current trend is losing momentum and may be ready to reverse.
- How it works:
- Bullish divergence: Price makes lower lows, but MACD makes higher lows
- Bearish divergence: Price makes higher highs, but MACD makes lower highs
- When to use:
Divergence is often used in swing or position trading, especially on larger timeframes like the 1-hour or daily chart. It can help traders anticipate reversals before they show up in price action. - Example:
In Nasdaq futures (NQ), if the price hits a new high but MACD forms a lower high, a bearish divergence could suggest a pullback is coming.
Try these MACD setups risk-free with a MetroTrader demo account and learn what works best for your trading style.
Strengths of the MACD Indicator
- Dual-purpose indicator: MACD tracks both trend direction and momentum, giving traders more insight than a simple moving average or momentum oscillator alone.
- Clear visual signals: With crossovers, a histogram, and the zero line, MACD provides straightforward signals that are easy to read on any chart.
- Adaptable across markets: Whether you’re trading index futures, metals, energies, or currencies, MACD can be applied to a wide range of contract types.
- Effective across timeframes: MACD works on everything from 1-minute charts for scalping to daily or weekly charts for swing and position trading.
- Customizable settings: Traders can adjust the EMA periods (e.g., 6-13-5 or 24-52-18) to better suit different volatility levels or trading strategies.
- Works well in trending markets: MACD tends to perform best when there is a strong directional move, helping traders stay on the right side of momentum.
Limitations of MACD in Futures
- Lagging by design: Because it’s based on moving averages, MACD reacts to price changes after they happen, which may lead to delayed entries or exits.
- Vulnerable to whipsaws: In sideways or choppy markets, MACD crossovers can generate false signals that result in quick reversals and stop-outs.
- Not ideal for scalping: On very short timeframes, such as tick or 1-minute charts, MACD may struggle to keep up with the speed of price movements.
- Requires confirmation: Relying on MACD alone can lead to poor decisions; it’s best used with support/resistance, candlestick patterns, or volume indicators.
- Can miss early reversals: MACD often lags behind fast reversals or news-driven moves, which are common in futures markets around economic reports or events.
- May need frequent tuning: Traders often need to adjust MACD settings based on the contract they’re trading and the current market volatility.
MACD vs RSI
While both MACD and RSI are momentum indicators, they measure different aspects of price behavior. Knowing how they differ helps traders decide when to use each or how to use them together for stronger signals.
What They Measure
MACD tracks the relationship between two exponential moving averages to show the direction and strength of momentum. It helps identify shifts in trend over time. RSI measures the speed and magnitude of recent price changes to spot overbought or oversold conditions. It’s often used to identify potential reversal points.
Signal Type
MACD is better suited for tracking trend direction through crossovers and histogram shifts. RSI is typically used to time entries or exits based on whether a market is overextended in either direction.
Market Conditions
MACD performs well in trending markets, where momentum builds over time. RSI is more effective in range-bound markets, where price moves between support and resistance levels.
Lag vs Sensitivity
MACD is a lagging indicator since it confirms trends after they’ve started, due to its reliance on moving averages. RSI is a leading indicator, meaning it often signals potential reversals before they happen, based on rapid price shifts.
Should You Use MACD or RSI?
You don’t have to pick one. Many traders use both together to improve timing and confirmation. For example:
- A bullish MACD crossover plus RSI rising from oversold can signal a strong long entry.
- A bearish MACD divergence paired with an RSI above 70 may indicate a coming reversal.
Explore both indicators on real-time charts with a MetroTrader demo account and fine-tune your strategy across contracts and timeframes.
Best Practices for Using MACD in Futures
- Test strategies in the demo before going live
- Adjust the settings for contract volatility (shorter EMAs for faster markets)
- Combine MACD with volume and chart patterns
- Avoid trading every crossover—filter signals with price context
- Always manage risk: Use stop-loss orders and proper position sizing
Viewing MACD on MetroTrader

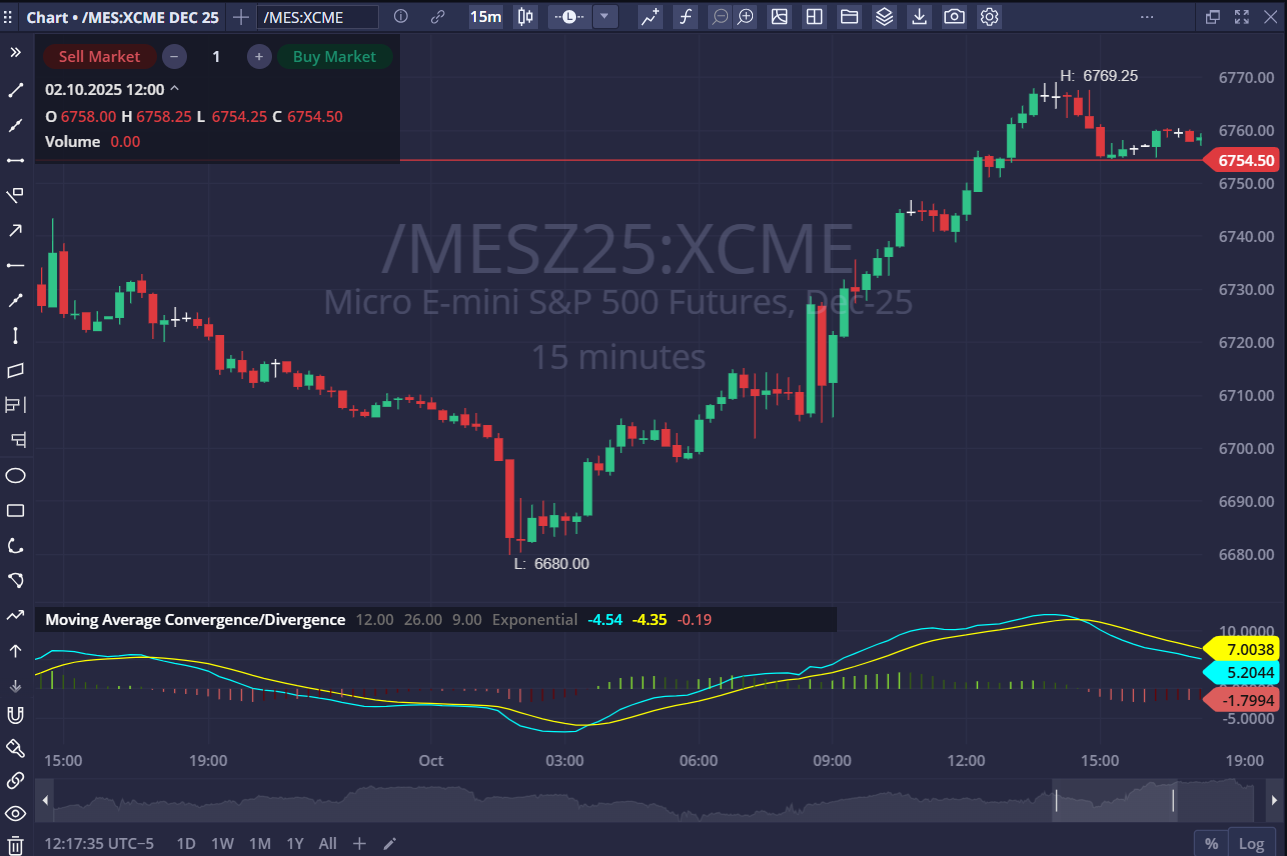
You can view and customize MACD directly on MetroTrader Web or Mobile:
- Open your contract chart
- Click the “Studies” icon (ƒ) and search for Moving Average Convergence Divergence
- Select MACD from the list
- Adjust periods if desired (default: 12, 26, 9)
- Customize line colors, histogram bars, and visibility
- Save settings for future use
Want to test this yourself? Create your free MetroTrader demo account and try MACD on real futures data.
Common Mistakes Futures Traders Make with MACD
- Trading every crossover blindly: Not all MACD crossovers lead to meaningful price moves. Without considering trend strength, support/resistance, or volume, traders may enter too early or get whipsawed.
- Ignoring market context: MACD behaves differently in trending vs choppy markets. Applying the same logic in all environments can lead to poor decisions and inconsistent results.
- Overusing short timeframes: On 1-minute or 5-minute charts, MACD can generate frequent signals that lag behind price action. This often results in late entries or false breakouts in fast-moving futures contracts.
- Failing to adjust settings: Default MACD settings may not suit every contract or trading style. Traders who don’t tailor the EMAs to their strategy or the volatility of the instrument may miss optimal setups.
- Relying solely on MACD: Like any indicator, MACD works best when used with confirmation tools. Ignoring chart patterns, price structure, or other indicators increases the risk of false signals.
- Forcing trades during news events: MACD does not account for sudden volatility caused by economic reports or headlines. Trading on MACD signals alone during news-heavy periods can result in fast, unexpected losses.
Avoid these mistakes by combining MACD with other analysis methods.
Conclusion
The MACD indicator is one of the most powerful tools available to futures traders. It helps identify momentum shifts, trend changes, and high-probability entry points. Whether you’re trading crude oil, the E-mini S&P 500, or gold, MACD can improve your technical analysis.
But like any tool, it works best when combined with sound risk management and confirmation from other indicators or price action.
Want to see MACD in action? Sign up for a MetroTrader demo account and start exploring futures markets today.
FAQs About that MACD Indicator
What is the MACD indicator in futures trading?
The MACD indicator is a momentum tool that helps futures traders identify trend direction and strength by analyzing the relationship between two exponential moving averages (EMAs).
How do you read MACD signals on a futures chart?
MACD signals are read by watching for crossovers between the MACD line and the signal line, movements above or below the zero line, and divergences between MACD and price action.
What is a bullish MACD crossover?
A bullish MACD crossover occurs when the MACD line crosses above the signal line, suggesting that upward momentum is increasing and a potential buying opportunity may be developing.
Is MACD a leading or lagging indicator?
MACD is a lagging indicator because it’s based on moving averages that reflect past price data. It’s best used to confirm trends rather than predict them in advance.
Can you use MACD for day trading futures?
Yes, MACD can be used for day trading futures by applying it to short timeframes like the 5-minute or 15-minute chart, though it’s important to confirm signals with other indicators or price levels.
What are the best MACD settings for futures trading?
The standard MACD settings (12, 26, 9) work well for swing trading, but shorter settings like 6, 13, 5 may be more responsive for active day trading or scalping futures contracts.
What’s the difference between MACD and RSI?
MACD shows trend direction and momentum using moving averages, while RSI measures overbought or oversold conditions based on recent price changes. Traders often use both together for confirmation.
How do I add MACD to a MetroTrader chart?
To add MACD on MetroTrader, open your chart, click “Studies,” select “MACD,” and adjust the settings if needed. You can also customize colors and save the layout for future use.
The content provided is for informational and educational purposes only and should not be considered trading, investment, tax, or legal advice. Futures trading involves substantial risk and is not suitable for every investor. Past performance is not indicative of future results. You should carefully consider whether trading is appropriate for your financial situation. Always consult with a licensed financial professional before making any trading decisions. MetroTrade is not liable for any losses or damages arising from the use of this content.


