In futures trading, timing matters. Markets can move quickly, and successful traders often rely on more than just gut instinct. That’s where technical analysis comes in.
Technical analysis helps traders study past price data to better understand where the market might go next. By looking at charts, indicators, and price patterns, futures traders can make more informed decisions about when to enter and exit trades.
Whether you’re brand new to trading or looking to sharpen your skills, this guide will show you how to use technical analysis effectively in the futures markets.
What Is Technical Analysis?
Technical analysis is the study of historical price and volume data to forecast future market movements. Unlike fundamental analysis, which looks at economic or company-specific data, technical analysis focuses only on what’s shown on the chart.
The key idea behind technical analysis is simple: Price reflects everything. News, earnings, inflation reports — it’s all believed to be “priced in” by the time you see a chart. That’s why traders use price charts to analyze market psychology and spot trading opportunities.
Why Use Technical Analysis in Futures Trading?
Futures markets are fast-moving, often influenced by short-term supply and demand shifts. This makes technical analysis especially useful. Here’s why:
- Price moves quickly. Technical tools can help traders keep up with fast changes.
- Works across asset classes. Whether you’re trading crude oil, stock index futures, or bitcoin, the same principles apply.
- Built for short-term strategies. Day traders and scalpers often rely heavily on charts and indicators to act fast.
In short, technical analysis is a core skill for most active futures traders.
Common Chart Types in Technical Analysis
Before you dive into indicators, it helps to understand the different types of price charts:
Line Chart
- Shows a single line connecting closing prices over time.
- Best for spotting overall trends but lacks detail.
Bar Chart
- Displays the open, high, low, and close (OHLC) for each time period.
- More detailed than line charts, good for comparing volatility.
Candlestick Chart
- Similar to bar charts but visually easier to read.
- “Candles” show the same OHLC data, with color coding for up and down days.
- Great for spotting patterns like reversals or momentum shifts.
Volume and Open Interest
- Volume shows how many contracts traded during a time period.
- Open interest tracks how many contracts are still open (not yet settled).
- Both are key tools for confirming price movements.
Top Technical Indicators for Futures Traders
Technical indicators are tools that help traders make sense of market movements. They use math and price data to highlight patterns, trends, and momentum — things that aren’t always obvious by just looking at a chart. Let’s break down some of the most common indicators you’ll see in futures trading.
1. Moving Averages (SMA & EMA)
What they are:
Moving averages help smooth out price data to show the overall trend. Instead of reacting to every tiny price change, moving averages give you a “big picture” view.
- SMA (Simple Moving Average): This calculates the average closing price over a set number of periods (like the past 20 days). Every data point is treated equally.
- EMA (Exponential Moving Average): This gives more weight to recent prices, so it reacts faster to new price changes.
Why it matters:
Moving averages help you spot whether a market is in an uptrend, downtrend, or moving sideways. They’re also used to create crossover strategies: for example, when a short-term average crosses above a long-term one, it may signal a buy.
Example:
If the 50-day EMA is above the 200-day EMA, traders might see that as a sign the market is strong. If it drops below, it could signal weakness.
2. Relative Strength Index (RSI)
What it is:
RSI is a momentum indicator. It shows whether a market is overbought (priced too high and may drop) or oversold (priced too low and may rise).
How it works:
RSI gives a score from 0 to 100.
- Above 70 = overbought
- Below 30 = oversold
Why it matters:
Traders use RSI to look for turning points. If RSI hits 75, the price may be due for a pullback. If it hits 25, the price might bounce back up.
Example:
If crude oil futures hit RSI 80 after a strong rally, some traders might take profits or look for a short trade setup.
3. MACD (Moving Average Convergence Divergence)
What it is:
MACD is a more advanced momentum indicator. It tracks how two moving averages relate to each other and shows shifts in momentum.
How it works:
MACD uses:
- A fast EMA (usually 12-period)
- A slow EMA (usually 26-period)
- A signal line (9-period EMA of the MACD line)
When the MACD line crosses above the signal line, it may suggest a buy. When it crosses below, it may suggest a sell.
Why it matters:
MACD is great for spotting momentum shifts and trend reversals — especially when price action alone is unclear.
Example:
If stock index futures have been falling, but MACD turns upward and crosses above the signal line, traders may see that as a sign of bullish momentum returning.
4. Bollinger Bands
What they are:
Bollinger Bands help measure volatility, or how much the market is moving up or down.
They consist of:
- A middle band (a moving average)
- An upper band (2 standard deviations above the average)
- A lower band (2 standard deviations below the average)
How to use them:
- When the bands are tight, the market is quiet — often before a breakout.
- When price touches the upper band, the market may be overbought.
- When price touches the lower band, the market may be oversold.
Why it matters:
Bollinger Bands help traders prepare for big moves and manage entry/exit points based on volatility.
Example:
If Bitcoin futures are moving sideways and the bands are tight, a breakout may be coming. If the breakout pushes price above the upper band, traders might go long.
5. Stochastic Oscillator
What it is:
The Stochastic Oscillator is another momentum tool. It compares the current price to its range over a certain number of periods (usually 14).
How it works:
It outputs two lines (%K and %D) on a scale from 0 to 100.
- Above 80 = overbought
- Below 20 = oversold
Crossovers between these lines can also signal potential changes in direction.
Why it matters:
This indicator works best in sideways markets where prices are bouncing between support and resistance.
Example:
If gold futures are ranging in a tight channel and the stochastic dips below 20, a trader might look for a long setup expecting a bounce.
Pro Tip: Don’t Use These in Isolation
Each indicator has strengths, but none work perfectly on their own. The best futures traders use a combination of indicators and confirm signals with price action or chart patterns. For example, combining RSI with support/resistance levels can give a more reliable setup than using RSI alone.
Must-Know Chart Patterns
Chart patterns help traders recognize market behavior and potential outcomes. Here are some of the most common:
Support and Resistance

- Support is a price level where demand tends to stop prices from falling.
- Resistance is where supply tends to stop prices from rising.
- These levels are key for setting entries, exits, and stop losses.
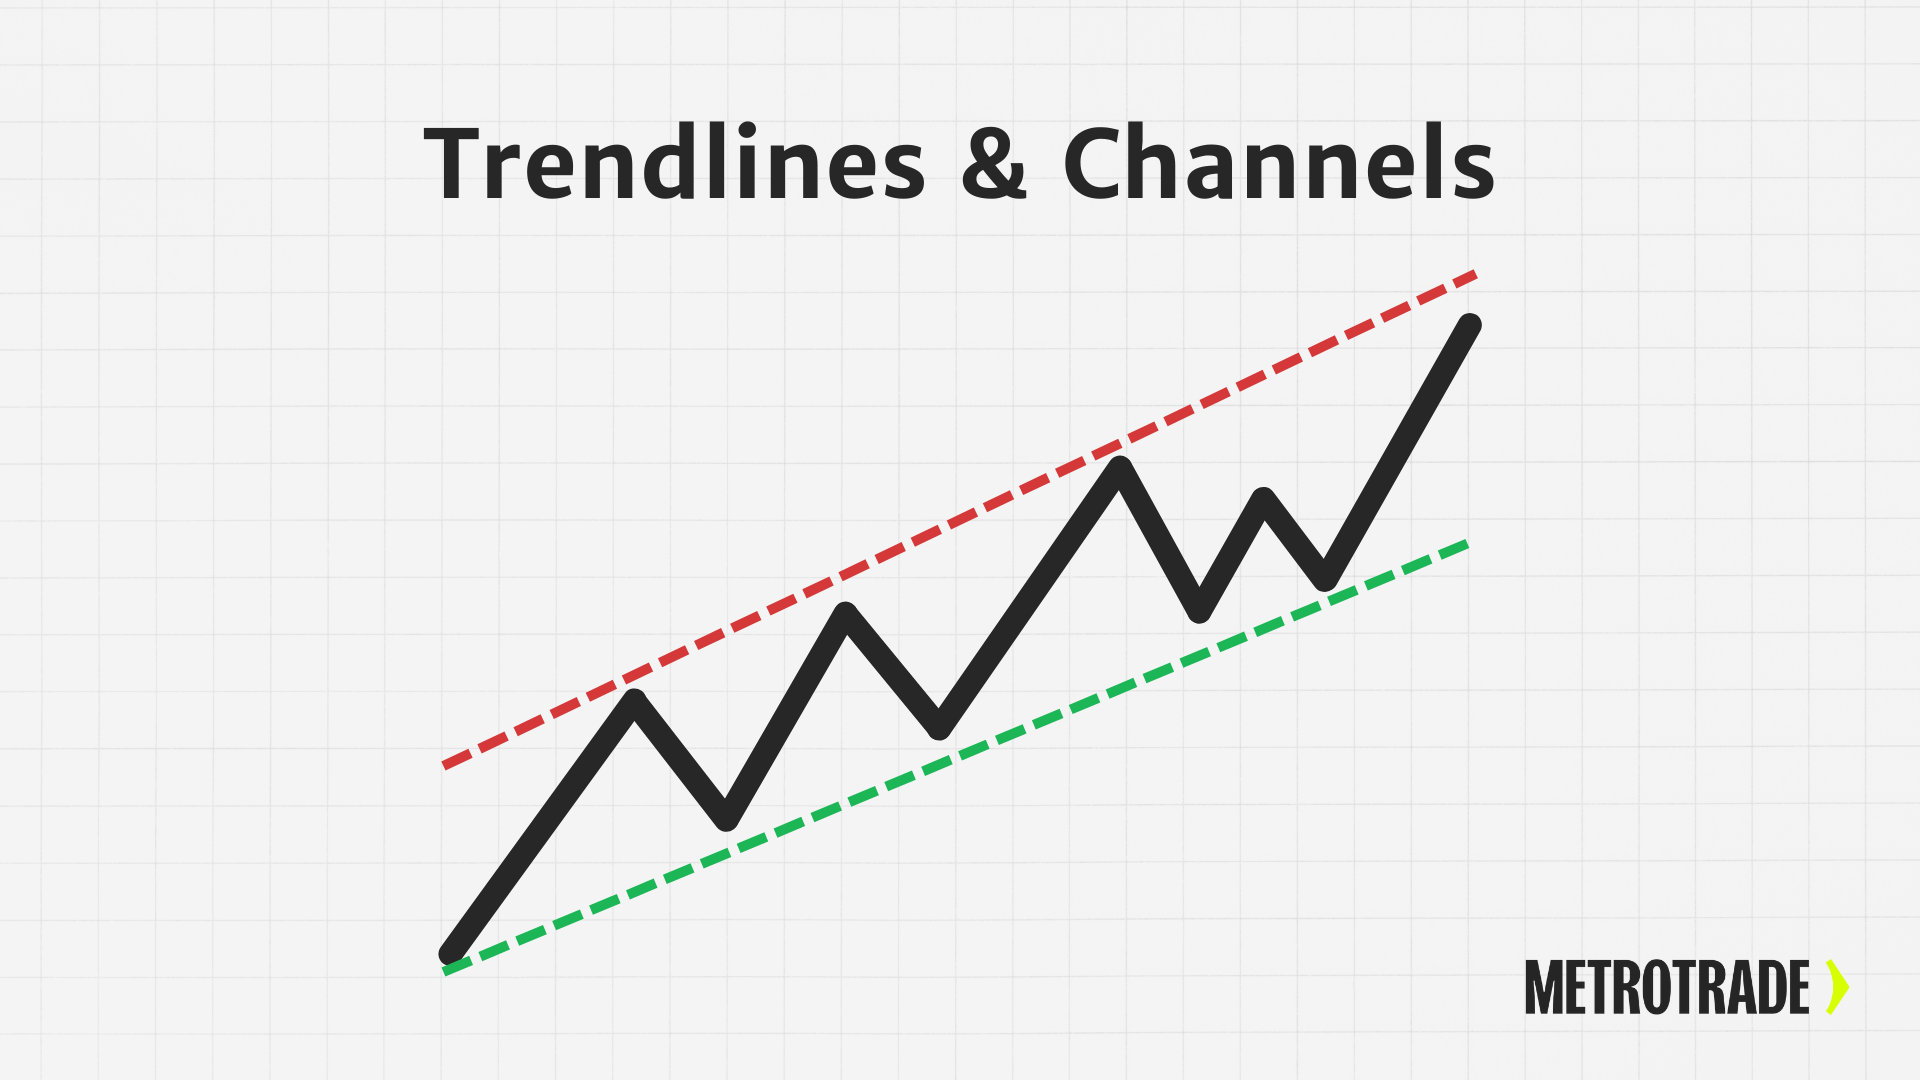
Trendlines and Channels

- Trendlines connect higher lows (uptrend) or lower highs (downtrend).
- Channels show price moving within a range, useful for breakout trades.
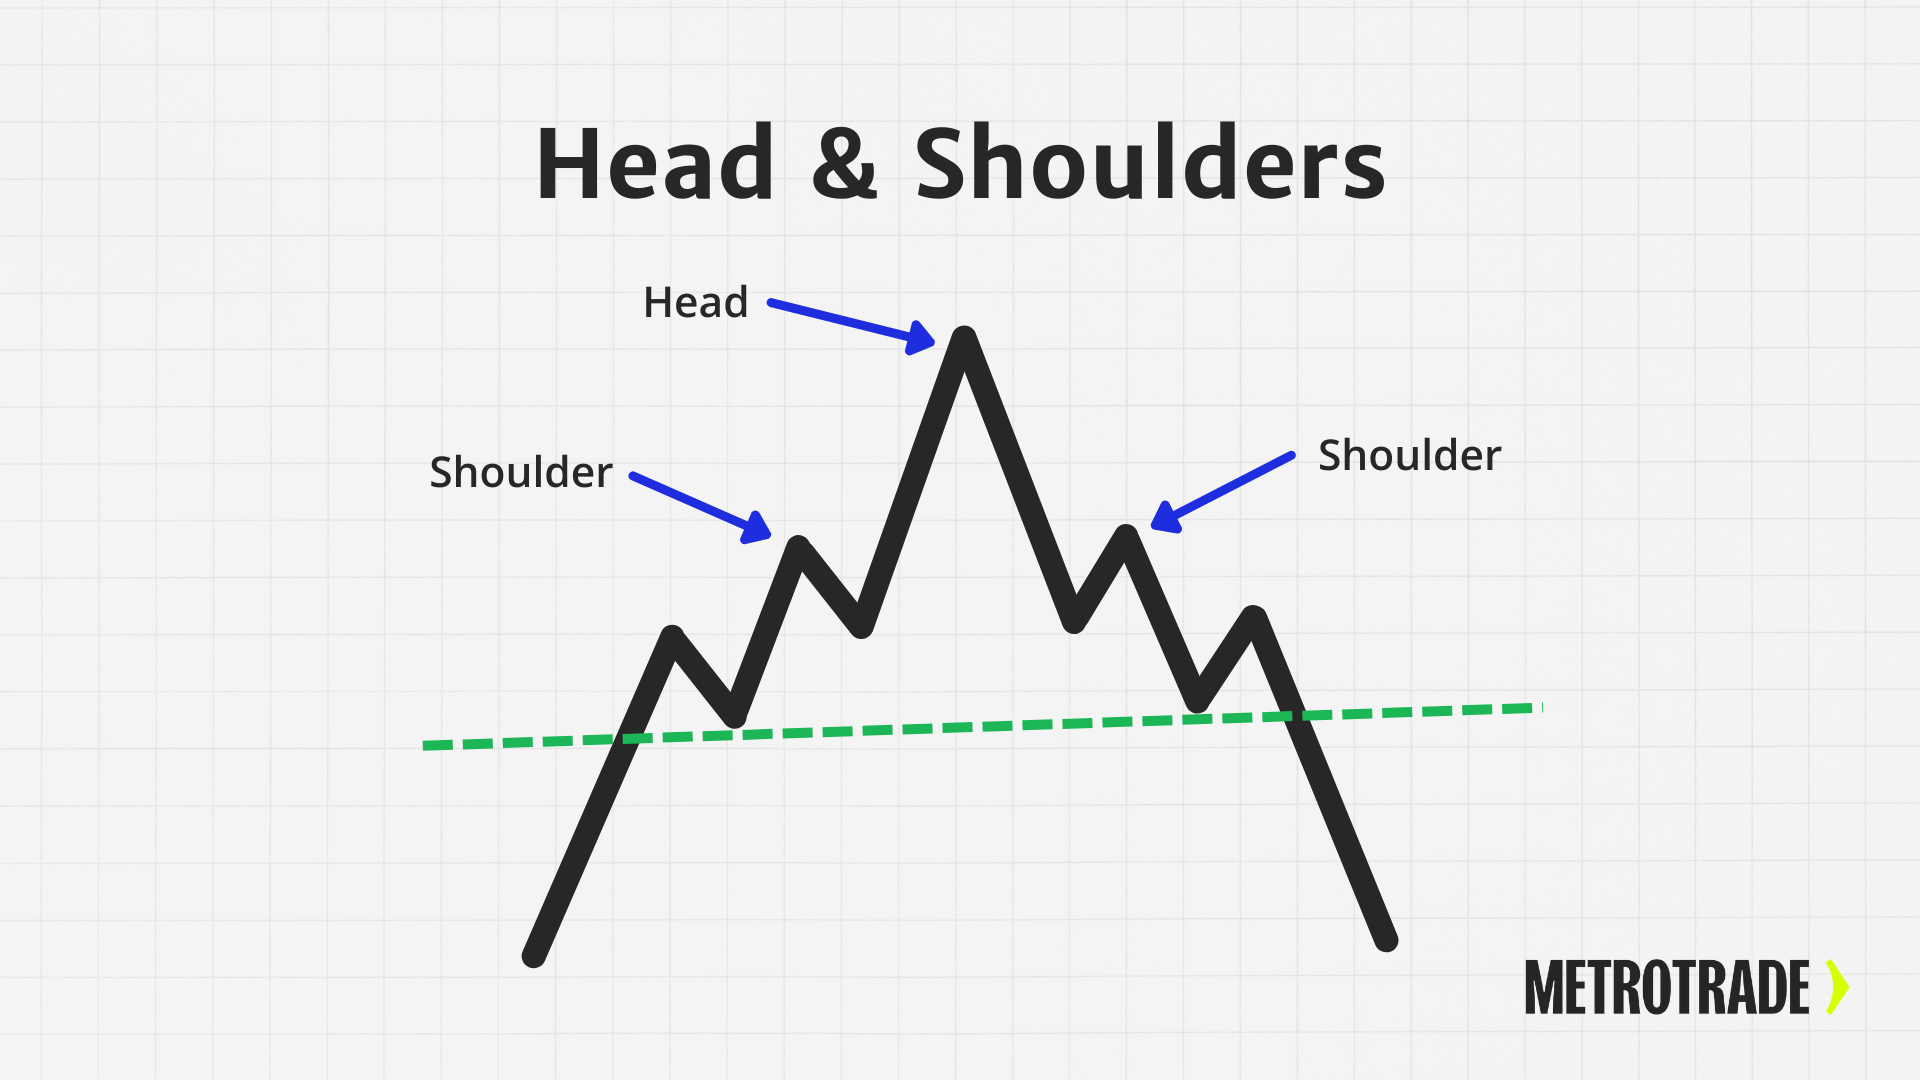
Head and Shoulders

- Signals a possible reversal after a trend
- Often followed by a price breakout in the opposite direction
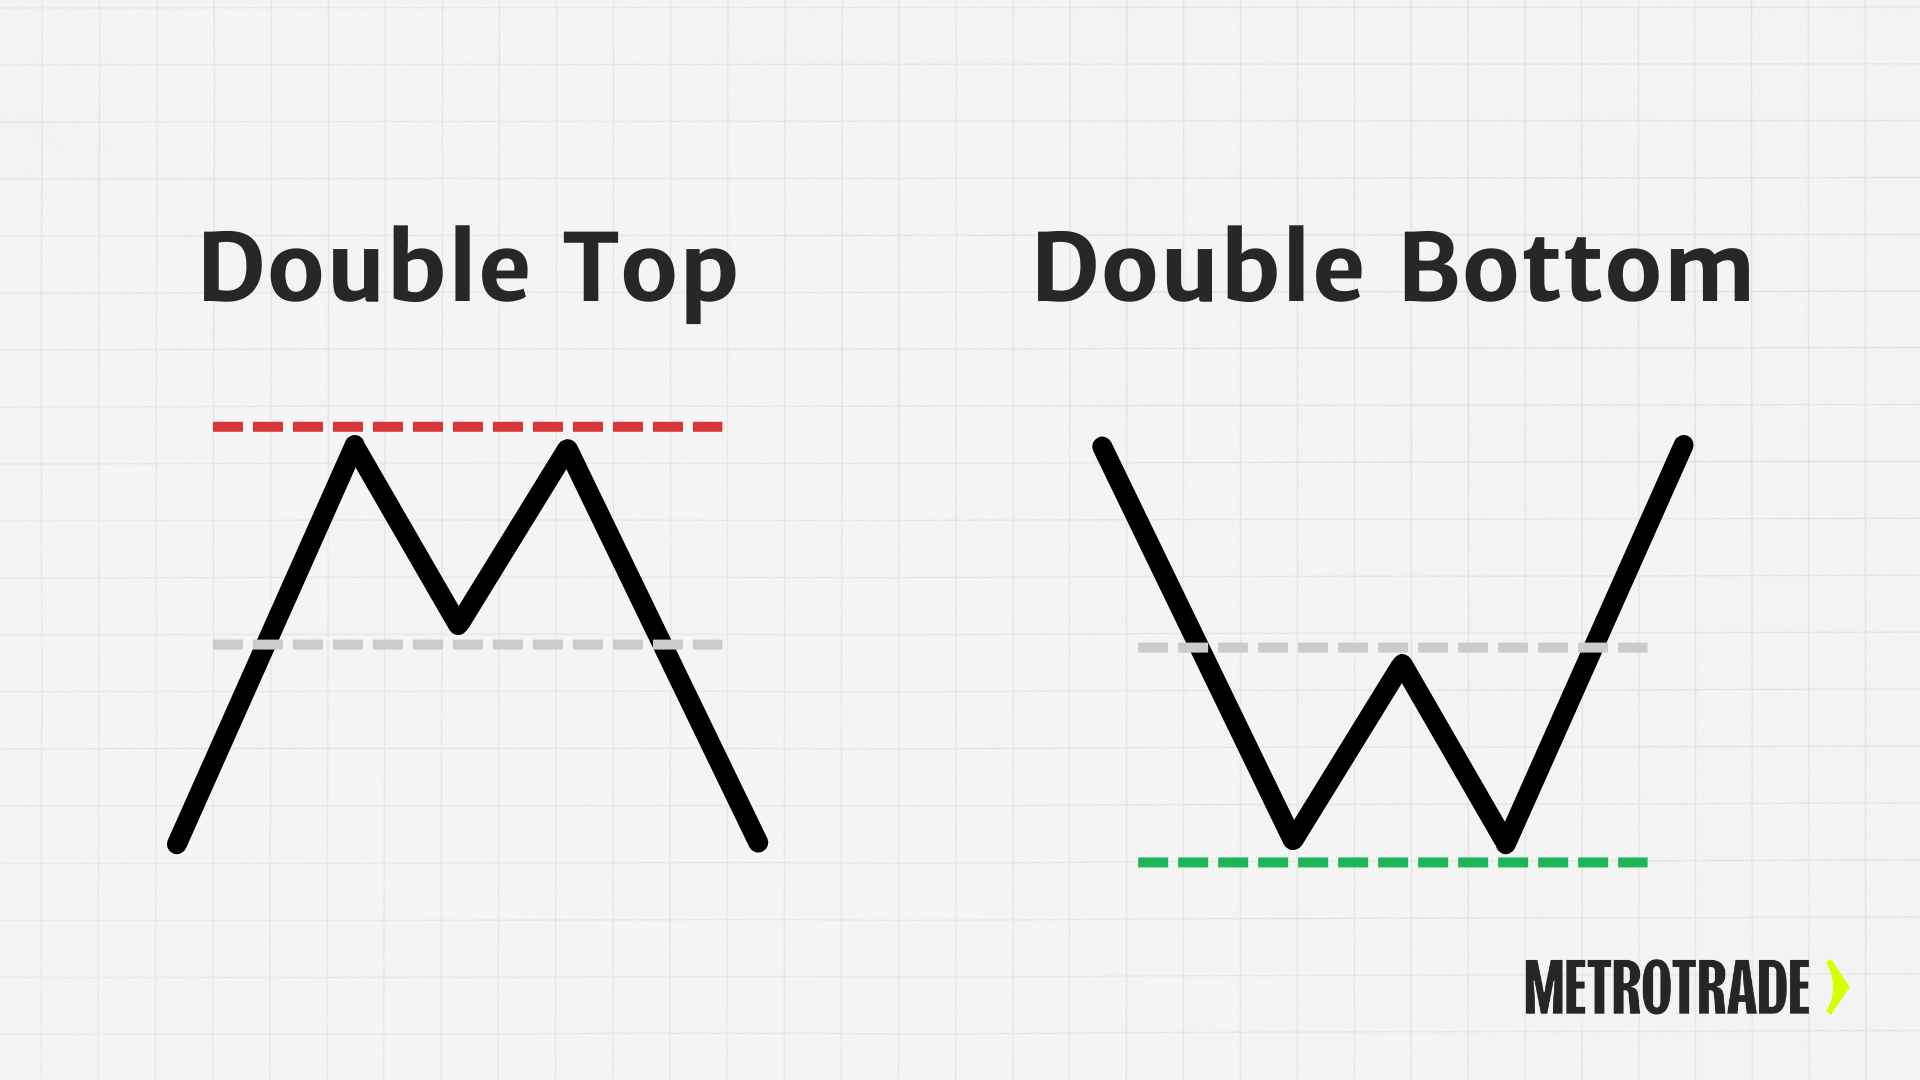
Double Top / Double Bottom

- Double Top = bearish reversal pattern
- Double Bottom = bullish reversal pattern
- Traders watch for confirmation before acting
Triangles (Ascending, Descending, Symmetrical)

- Formed by converging trendlines
- Often signal that a breakout is coming, but not always clear which way
Patterns are most useful when combined with volume and other indicators for confirmation.
Time Frames in Technical Analysis
Your chart’s time frame can dramatically change what you see.
- 1-minute to 15-minute charts = Good for scalping or day trading
- Hourly charts = Help spot short-term swings
- Daily or weekly charts = Useful for swing trading or big-picture analysis
Make sure your indicator settings match your chosen time frame. For example, a 50-day moving average might work well on a daily chart but not on a 5-minute chart.
Combining Indicators and Price Action
No single indicator works 100% of the time. That’s why experienced traders look for confluence, or agreement between multiple tools.
A Potential Example Strategy:
- Price hits support
- RSI is below 30 (oversold)
- MACD shows a bullish crossover
This combined setup may signal a strong buy opportunity, but always manage risk.
Avoid “Indicator Overload”
- Too many indicators can confuse rather than clarify
- Stick to 2–3 that you understand well
- Always test strategies before risking real money
Technical Tools in Futures Trading Platforms
Modern trading platforms (including MetroTrader) offer built-in technical tools to help you analyze the market efficiently.
Useful Platform Tools:
- Chart overlays (SMA, RSI, MACD, etc.)
- Drawing tools (trendlines, Fibonacci retracements)
- Alerts and custom indicators
- Backtesting tools for trying out strategies on historical data
Make time to learn your platform’s full charting features. A well-marked chart is a trader’s best friend.
Limitations of Technical Analysis
Even though technical analysis is powerful, it’s not foolproof.
- Lagging indicators: Many tools react after a move starts
- False signals: Patterns don’t always play out
- Overfitting: Some strategies work great in backtests but fail in live markets
The best way to use technical analysis is as part of a bigger plan — one that includes strong risk management, emotional discipline, and continuous learning.
Tips for Beginners Using Technical Analysis
Getting started with technical analysis takes time, but you can speed up the learning curve with these tips:
1. Learn One Tool at a Time
Don’t try to master everything at once. Start with simple moving averages or RSI, then build from there.
2. Use a Demo Account
Practice on a futures trading demo account before risking real money. This gives you time to test your setups in real market conditions.
3. Keep a Trading Journal
Track your trades, setups, and results. This helps you learn from mistakes and improve faster.
4. Be Consistent
Stick to your plan. Don’t jump from strategy to strategy based on emotion or fear of missing out.
5. Stay Humble
Even top traders get it wrong. The goal is not to win every trade: it’s to manage risk and stay in the game long term.
Conclusion
Technical analysis is a powerful skill for any futures trader. By learning how to read charts, apply indicators, and recognize patterns, you can make better trading decisions and improve your timing.
But remember: it’s not about finding the perfect indicator or pattern. It’s about building a system you understand, testing it carefully, and applying it with discipline.
Ready to take the next step? Open a MetroTrader demo account today and start practicing technical analysis in real market conditions.
FAQs About Futures Technical Analysis
What is the best technical indicator for futures trading?
There’s no single best indicator, but many futures traders rely on moving averages, RSI, and MACD to identify trends and momentum. The best indicator depends on your trading style and time frame.
Can you use technical analysis on all types of futures contracts?
Yes, technical analysis can be applied to all liquid futures contracts, including commodities, equity indexes, crypto, interest rates, and currencies. The key is choosing time frames and indicators that match your strategy.
How do you read a futures trading chart for beginners?
Start by selecting a chart type, like candlesticks, and add basic indicators such as moving averages. Look for trends, support and resistance levels, and volume changes to help guide your trading decisions.
What’s the difference between SMA and EMA in technical analysis?
SMA (Simple Moving Average) gives equal weight to all past prices, while EMA (Exponential Moving Average) gives more weight to recent prices. EMA reacts faster to price changes, which can be helpful in fast-moving futures markets.
How accurate is technical analysis in futures trading?
Technical analysis is a useful tool, but it’s not 100% accurate. Indicators and patterns help traders make informed decisions, but they work best when combined with strong risk management and consistent strategy.
What time frame is best for technical analysis in futures trading?
Scalpers may use 1- to 5-minute charts, day traders may prefer 15-minute to hourly charts, and swing traders typically may use daily charts. Choose a time frame that matches your trading goals and holding period.
The content provided is for informational and educational purposes only and should not be considered trading, investment, tax, or legal advice. Futures trading involves substantial risk and is not suitable for every investor. Past performance is not indicative of future results. You should carefully consider whether trading is appropriate for your financial situation. Always consult with a licensed financial professional before making any trading decisions. MetroTrade is not liable for any losses or damages arising from the use of this content.


