If you’ve opened an options chain for the first time, the table of numbers can feel overwhelming. Rows of strikes, columns of Greeks, and two sides of prices staring back at you with no obvious starting point.
But every column in an options chain has a specific purpose. Once you know what each one means, the table becomes a clear map of available contracts, their costs, and how they respond to price movement. This guide walks through how to read an options chain for futures options, using the Micro E-mini S&P 500 (MES) as the primary example throughout.
Key Takeaways
- An options chain is a table of all available options contracts for a given futures contract, organized by strike price and expiration date, with calls on the left and puts on the right.
- Strike prices, expiration dates, and bid/ask prices are the three columns you need to read before placing any trade, as they define the contract terms and what you’ll pay to enter.
- Open interest shows how many contracts are currently active at a given strike, which helps you gauge liquidity and identify price levels the market is watching closely.
- The Greeks, including delta, theta, vega, and gamma, measure how an option’s price responds to changes in the underlying futures price, time, and volatility.
- Implied volatility (IV) reflects the market’s expectation of future price movement and directly affects how expensive or cheap options are priced at any given time.
What Is an Options Chain?
An options chain is a table that displays every available options contract for a specific futures contract, organized by strike price and expiration. It shows you the full menu of options you can buy or sell, along with the current pricing and market data for each one.
Each row in the chain represents one strike price. Each column provides a different data point about that contract, such as its current bid and ask prices, how much volume has traded today, and how sensitive the option is to price movement.
The chain is split into two sides. Calls appear on the left, puts appear on the right, and strike prices run down the center column. A call option gives the buyer the right, but not the obligation, to buy the underlying futures contract at the strike price. A put option gives the buyer the right to sell at the strike price.
How Futures Options Differ from Equity Options
Futures options work the same way as equity options in terms of structure, but the underlying asset is a futures contract rather than a stock.
When you buy a call on the MES, for example, you’re buying the right to go long an MES futures contract at a specific strike price. If the option is exercised, you receive a futures position, not shares of a company.
A few other differences to keep in mind:
- Settlement: Many CME futures options settle into an actual futures position upon exercise, rather than a cash amount or stock delivery.
- Margin: Selling futures options requires margin, and the requirements differ from those on equity options.
- Contract specs: Each futures options chain is tied to a specific futures contract. The MES chain covers Micro E-mini S&P 500 options. The CL chain covers crude oil options. The GC chain covers gold options. Each has its own tick size, expiration schedule, and contract multiplier.
Understanding these distinctions helps you interpret what you’re seeing in the chain and how a trade would behave if executed.
The Structure of a Futures Options Chain

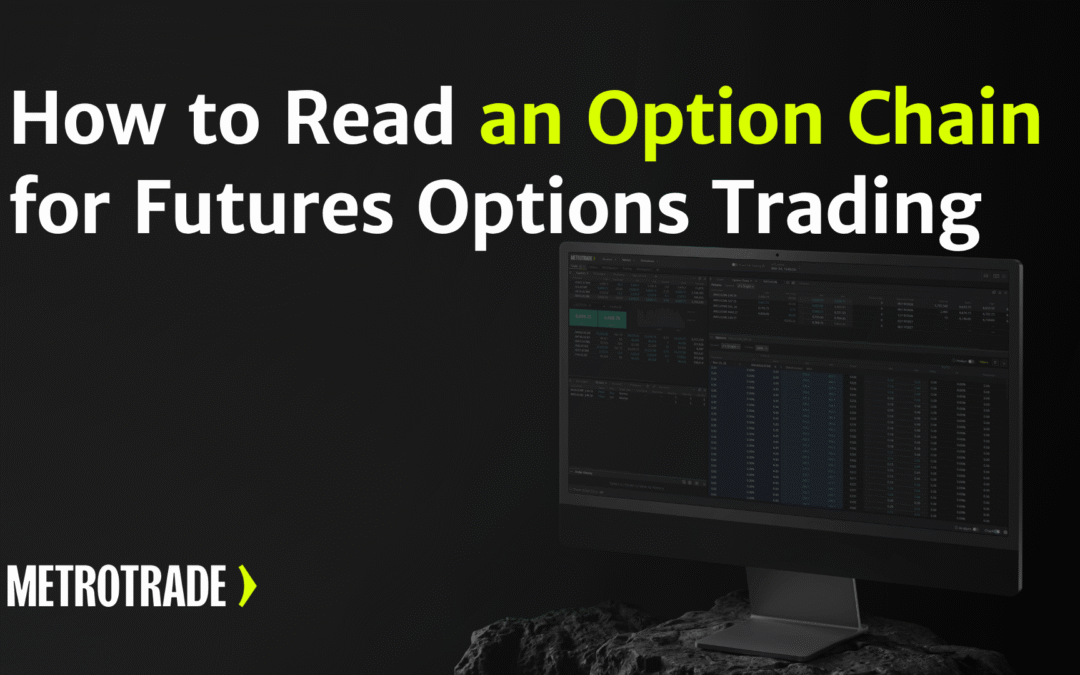
The MetroTrader options chain for MES:XCME displays a layout you’ll encounter across most futures options platforms. The interface has two distinct sections: a futures panel at the top and the options chain below it.
The futures panel lists all available expiration contracts for the underlying. For MES, this includes the JUN 26, SEP 26, DEC 26, MAR 27, and JUN 27 contracts, each displayed as its own row with columns for the last price, net change, bid, ask, position quantity, expiration date, volume, and session open and high. This is where you select which contract’s options you want to view.
The options chain below updates to reflect whichever futures contract is selected. For MES:XCME JUN 26, calls appear on the left, puts appear on the right, and strike prices run down the center.
Here’s what each section of the chain contains.
Calls vs. Puts
The left side of the chain lists call options for every available strike. The right side lists put options for the same strikes. Both sides share the same central column of strike prices, so you can compare a call and a put at the same strike in a single row.
Calls gain value when the underlying futures contract rises. Puts gain value when it falls. When you’re reading the chain, the side you focus on depends on your market view. If you expect MES to move higher, you’re looking at the left side. If you expect it to move lower, you’re looking at the right.
Strike Prices
The strike price is the price at which an option gives the holder the right to buy or sell the underlying futures contract. Strikes run vertically down the center of the chain in fixed increments, with each row representing a different level.
Three terms describe a strike’s relationship to the current futures price:
- In the money (ITM): A call is ITM when the strike is below the current futures price. A put is ITM when the strike is above it.
- At the money (ATM): The strike closest to the current futures price.
- Out of the money (OTM): A call is OTM when the strike is above the current futures price. A put is OTM when the strike is below it.
Example: If MES is trading at 6,608, a call at the 6,550 strike is in the money. A call at the 6,650 strike is out of the money. The strike nearest 6,608 is at the money.
In the MetroTrader chain, strikes are displayed in 5-point increments for MES. The Strikes filter at the top of the options panel controls how many strikes are visible. The default view shows 50% of available strikes, centered around the ATM level.
Expiration Dates
The expiration row sits directly above the strike list and displays the settlement date, contract identifier, and cycle label. In the MetroTrader interface, this row shows details such as the date, the specific options contract symbol (for example, /MESM26:XCME), and a label like Wk4 indicating which weekly cycle the expiration belongs to.
CME futures options offer both weekly and monthly expirations for many contracts. Weekly options expire faster and are often used for short-term directional trades. Monthly options give more time for a trade to develop and are more common for spread strategies.
Shorter expirations come with faster time decay. A weekly option loses value much more quickly than a monthly option, all else being equal. When reading the chain, always confirm which expiration you’re viewing before analyzing prices, because the same strike will look very different across different expiration dates.
Bid and Ask Prices
The bid is the highest price a buyer is currently willing to pay for the option. The ask is the lowest price a seller will accept. These two columns are the most important for understanding what a trade will actually cost.
On the calls side, bid and ask appear as the two rightmost columns before the strike. On the puts side, bid and ask appear as the two leftmost columns after the strike. In the MetroTrader chain, bid prices are displayed in orange and ask prices in teal, making them easy to distinguish as you scan across rows.
The difference between the bid and the ask is the spread. In liquid strikes near the ATM, the spread is typically tight. In far OTM strikes with low activity, the spread can be wide, meaning you pay more in transaction cost just to enter the position.
Practical note: Avoid filling at the ask when buying or at the bid when selling unless the market is moving quickly. Placing a limit order near the midpoint of the bid and ask gives you a better entry price and reduces slippage.
Last Price and Volume
The last price reflects the most recent transaction for that contract. In active strikes near ATM, the last price usually tracks current market conditions well. In low-volume strikes, the last price may be hours old and no longer meaningful.
Volume shows how many contracts have traded during the current session. Higher volume at a strike means more market participants are active there, which generally leads to tighter bid/ask spreads and easier fills.
When you see a strike with a wide bid/ask spread and near-zero volume, treat that as a caution sign. Entering or exiting that contract may cost more than anticipated.
Open Interest
Open interest is the total number of options contracts at a given strike that are currently open, meaning they have not been exercised, expired, or closed.
Unlike volume, which resets each day, open interest accumulates over time. A strike with 5,000 contracts of open interest has significantly more market participation than one with 50.
Traders use open interest in two ways:
- Liquidity check: High open interest at a strike typically means tighter spreads and better fills.
- Market structure: Large clusters of open interest at specific strikes can indicate levels where the market has concentrated activity, which some traders use as reference points when planning trades.
Understanding the Greeks in a Futures Options Chain
The Greeks are a set of measurements that describe how an option’s price is expected to change in response to different variables. In the MetroTrader chain, delta and IV appear as dedicated columns on both the calls and puts sides. Theta, vega, and gamma are available through the platform’s analysis tools and are important to understand even when not visible directly in the main chain view.
Delta
Delta measures how much an option’s price is expected to move for every one-point move in the underlying futures contract. Call options have a delta between 0 and 1. Put options have a delta between -1 and 0.
In the MetroTrader chain, delta appears as a column on both sides: to the right of the ask on the calls side, and to the right of the ask on the puts side as well. An ATM option typically has a delta near 0.50, meaning it moves approximately 0.50 points for every 1-point move in MES. Deep ITM options have deltas closer to 1.00. Far OTM options have deltas near zero.
Example: An MES call with a delta of 0.40 would gain approximately 0.40 points in value if MES rises by 1 point, assuming all other variables stay the same.
Delta also functions as a rough probability estimate. A delta of 0.25 suggests the market is pricing in roughly a 25% chance that the option expires in the money.
Theta
Theta measures time decay: the amount of value an option loses each day as it approaches expiration, with all else equal.
For options buyers, theta works against you. The option loses a portion of its value every day you hold it, even if the futures price doesn’t move. For options sellers, theta works in the other direction, as that daily time decay represents premium collected.
Theta accelerates in the final weeks before expiration. A 30-day option decays slowly at first, then more rapidly as the expiration date approaches. This is especially relevant when selecting between weekly and monthly expirations.
Vega
Vega measures how much an option’s price changes for every 1% change in implied volatility. Options with higher vega are more sensitive to volatility shifts.
This matters most around scheduled economic events. Before an FOMC announcement or a Non-Farm Payrolls report, implied volatility tends to rise, which inflates option prices. After the event, IV often drops sharply, a phenomenon traders call a volatility crush, which can reduce an option’s value even if the underlying moved in the expected direction.
Gamma
Gamma measures the rate at which delta changes as the underlying futures price moves. It tells you how quickly your directional exposure is shifting as the market moves.
Gamma is highest for ATM options that are close to expiration. In that situation, a small move in the futures price can cause a large change in delta, and therefore a large swing in the option’s value. Traders who are short ATM options near expiration carry significant gamma risk.
Implied Volatility (IV)
Implied volatility is the market’s expectation of how much the underlying futures contract will move over the life of the option, expressed as an annualized percentage. It is derived from current option prices rather than historical price data.
Higher IV means options are more expensive. Lower IV means options are cheaper. Traders compare current IV to recent historical levels to assess whether they are buying or selling options at a relatively high or low price.
In the MetroTrader chain, IV appears as a percentage column on both sides of the chain, adjacent to delta. It is one of the most important columns to check before entering a position, particularly around high-impact economic events.
How to Read a Futures Options Chain Step by Step
Follow these steps when opening an options chain for the first time in MetroTrader:
- Select the futures contract. In the futures panel at the top of the screen, locate the contract you want to trade. For MES, you’ll see multiple expiration rows listed: JUN 26, SEP 26, DEC 26, and further out. Click the row for the contract you want to trade options on.
- Open the options chain. The options panel below will populate with calls and puts for the selected futures contract. Confirm the contract label in the options header matches what you selected.
- Choose an expiration date. Review the expiration row above the strike list. Note the settlement date and cycle label. Select a weekly or monthly expiration that fits your intended trade timeframe.
- Identify the ATM strike. Find the strike closest to the current futures price shown in the top panel. This is your reference point for the rest of the chain. In MetroTrader, the ATM area is typically where bid and ask prices are most active.
- Review bid and ask prices near ATM. Check the spread between the orange bid and teal ask. If the spread is wide relative to the option price, liquidity may be a concern at that strike.
- Check delta. Use the delta column to understand how much directional exposure the option provides. A delta near 0.50 means the option moves roughly in step with the futures. Lower delta means less sensitivity to price movement.
- Review IV. Check the IV column on the side you’re trading. If IV is elevated relative to recent levels, options are more expensive than usual. Factor this into your strike and expiration selection before placing an order.
Using the Option Chain to Plan a Trade
The chain isn’t just for viewing prices. It’s a decision-making tool for selecting the right contract before entering a position.
Example: A trader expects MES to move higher before the current weekly expiration. They open the MES:XCME JUN 26 options chain in MetroTrader, confirm the current futures price in the top panel, and locate the ATM strike in the options chain below.
They scan the calls side looking for a strike with:
- A delta between 0.30 and 0.50 for meaningful but not excessive directional exposure
- An IV level that doesn’t suggest options are unusually expensive ahead of a known event
- A bid/ask spread that’s tight enough to allow a reasonable fill near the midpoint
After selecting a strike, they note the ask price, calculate the total cost of the contract based on the MES multiplier, and confirm that the risk fits within their trade plan before submitting the order.
Buying a call or put on a futures options chain gives you defined risk. The most you can lose is the premium paid. This is different from selling options, which carries different risk characteristics and requires a thorough understanding of margin requirements and potential exposure before attempting.
Common Mistakes When Reading an Options Chain
Even experienced traders make avoidable errors when working with options chains. These are the most common:
- Using last price instead of the bid/ask midpoint. Last price can be stale in low-volume strikes. Always reference the current bid and ask before entering.
- Choosing strikes based on low premium alone. A cheap OTM option often has a low delta and a low probability of expiring in the money. Low cost does not mean good value.
- Ignoring the bid/ask spread. A wide spread in an illiquid strike can cost you as much as the option’s movement might earn you. Check the spread before assuming a price is accessible.
- Overlooking time decay. Buying a short-dated option requires the underlying to move quickly. If it doesn’t, theta erodes the position regardless of direction.
- Treating IV as a directional signal. High IV means the market expects movement, but it does not indicate which direction. Confusing elevated IV with a bullish or bearish bias is a common source of poor entries.
Conclusion
An options chain contains all the information you need to evaluate a futures options trade before entering it. The structure is consistent: a futures panel at the top for contract and expiration selection, calls on the left of the chain, puts on the right, strike prices in the center, and columns for bid, ask, delta, and IV running across each side.
Start by selecting your contract and expiration in the futures panel, orient yourself with the ATM strike in the chain, check the bid/ask spread and open interest for liquidity, and use delta and IV to understand the contract’s behavior and cost. From there, the chain becomes a practical decision tool rather than an intimidating table of numbers.
If you want to start trading futures and futures options, open your live MetroTrade account today.
FAQs
What is an options chain in futures trading?
An options chain is a table that lists all available call and put options for a specific futures contract, organized by strike price and expiration date. It shows current bid and ask prices, delta, implied volatility, and other data for each contract.
How do you read strike prices on a futures options chain?
Strike prices run down the center column of the chain. The strike closest to the current futures price is the at-the-money (ATM) strike. Strikes below the current price are in the money for calls and out of the money for puts. Strikes above the current price are out of the money for calls and in the money for puts.
What is open interest in an options chain?
Open interest is the total number of options contracts at a given strike that are currently open and have not been exercised, expired, or closed. High open interest generally indicates better liquidity and tighter bid/ask spreads at that strike.
What does delta mean in a futures options chain?
Delta measures how much an option’s price is expected to change for every one-point move in the underlying futures contract. Call deltas range from 0 to 1. Put deltas range from -1 to 0. An ATM option typically has a delta near 0.50.
What is the difference between bid and ask on an options chain?
The bid is the highest price a buyer will pay for an option. The ask is the lowest price a seller will accept. The difference between the two is the spread. Entering a trade near the midpoint of the bid and ask reduces the cost of getting in and out of a position.
What is implied volatility and why does it matter in options?
Implied volatility (IV) is the market’s expectation of future price movement in the underlying futures contract, expressed as an annualized percentage. Higher IV means options are priced more expensively. Lower IV means they are cheaper. Traders use IV to assess whether they are paying a fair price relative to recent conditions.
How is a futures options chain different from a stock options chain?
The structure of the chain is similar, but the underlying asset is a futures contract rather than a stock. If a futures option is exercised, the holder receives a futures position rather than shares. Margin requirements and contract specifications also differ from equity options.
What expiration should I choose when trading futures options?
The right expiration depends on your trade timeframe and strategy. Weekly options work for short-term setups but carry faster time decay. Monthly options provide more time for a trade to develop and are more common for multi-leg strategies. As a general rule, match the expiration to the timeframe of your expected move.
The content provided is for informational and educational purposes only and should not be considered trading, investment, tax, or legal advice. Futures trading involves substantial risk and is not suitable for every investor. Past performance is not indicative of future results. You should carefully consider whether trading is appropriate for your financial situation. Always consult with a licensed financial professional before making any trading decisions. MetroTrade is not liable for any losses or damages arising from the use of this content.
Transactions in options carry a high degree of risk. Purchasers and sellers of options should familiarize themselves with the type of option (i.e. put or call) which they contemplate trading and the associated risks. You should calculate the extent to which the value of the options must increase for your position to become profitable, taking into account the premium and all transaction costs. The purchaser of options may offset or exercise the options or allow the options to expire. The exercise of an option results either in a cash settlement or in the purchaser acquiring or delivering the underlying interest. If the option is on a future, the purchaser will acquire a futures position with associated liabilities for margin (see the section on Futures above). If the purchased options expire worthless, you will suffer a total loss of your investment, which will consist of the option premium plus transaction costs. If you are contemplating purchasing deep out-of-the-money options, you should be aware that the chance of such options becoming profitable ordinarily is remote. Selling (‘writing’ or ‘granting’) an option generally entails considerably greater risk than purchasing options.
Although the premium received by the seller is fixed, the seller may sustain a loss well in excess of that amount. The seller will be liable for an additional margin to maintain the position if the market moves unfavorably. The seller will also be exposed to the risk of the purchaser exercising the option, and the seller will be obligated to either settle the option in cash or to acquire or deliver the underlying interest. If the option is on a future, the seller will acquire a position in a future with associated liabilities for margin (see the section on Futures above). If the position is ‘covered’ by the seller holding a corresponding position in the underlying interest or a future or another option, the risk may be reduced. If the option is not covered, the risk of loss can be unlimited. Certain exchanges in some jurisdictions permit deferred payment of the option premium, exposing the purchaser to liability for margin payments not exceeding the amount of the premium. The purchaser is still subject to the risk of losing the premium and transaction costs. When the option is exercised or expires, the purchaser is responsible for any unpaid premiums outstanding at that time.