Candlestick charts help traders make sense of price action. They show the emotional tug-of-war between buyers and sellers over time. For those new to trading, some candlestick patterns stand out as reliable signals for possible market reversals. One of the most popular is the engulfing candlestick pattern.
This guide breaks down what an engulfing pattern looks like, how to spot it, and how traders use it to make better decisions. You’ll learn the differences between bullish and bearish engulfing candles, how they compare to other common patterns, and how to trade them in a structured way.
Whether you’re just getting started or want to sharpen your technical skills, this article will give you the foundation to understand and use the engulfing candlestick in your own trading.
Key Takeaways
- An engulfing candlestick pattern signals a potential trend reversal when a larger candle completely covers the previous candle’s real body, suggesting a strong shift in momentum.
- Bullish engulfing patterns occur at the bottom of a downtrend and may signal a bounce or full reversal to the upside. Bearish engulfing patterns appear after an uptrend and may indicate growing selling pressure.
- Traders use engulfing candlestick patterns alongside support and resistance, volume, and momentum indicators to validate setups and improve timing.
- While useful across all timeframes, engulfing patterns are most reliable on higher timeframes like the 4-hour or daily chart, where market noise is reduced and follow-through is stronger.
What Is an Engulfing Candlestick Pattern?

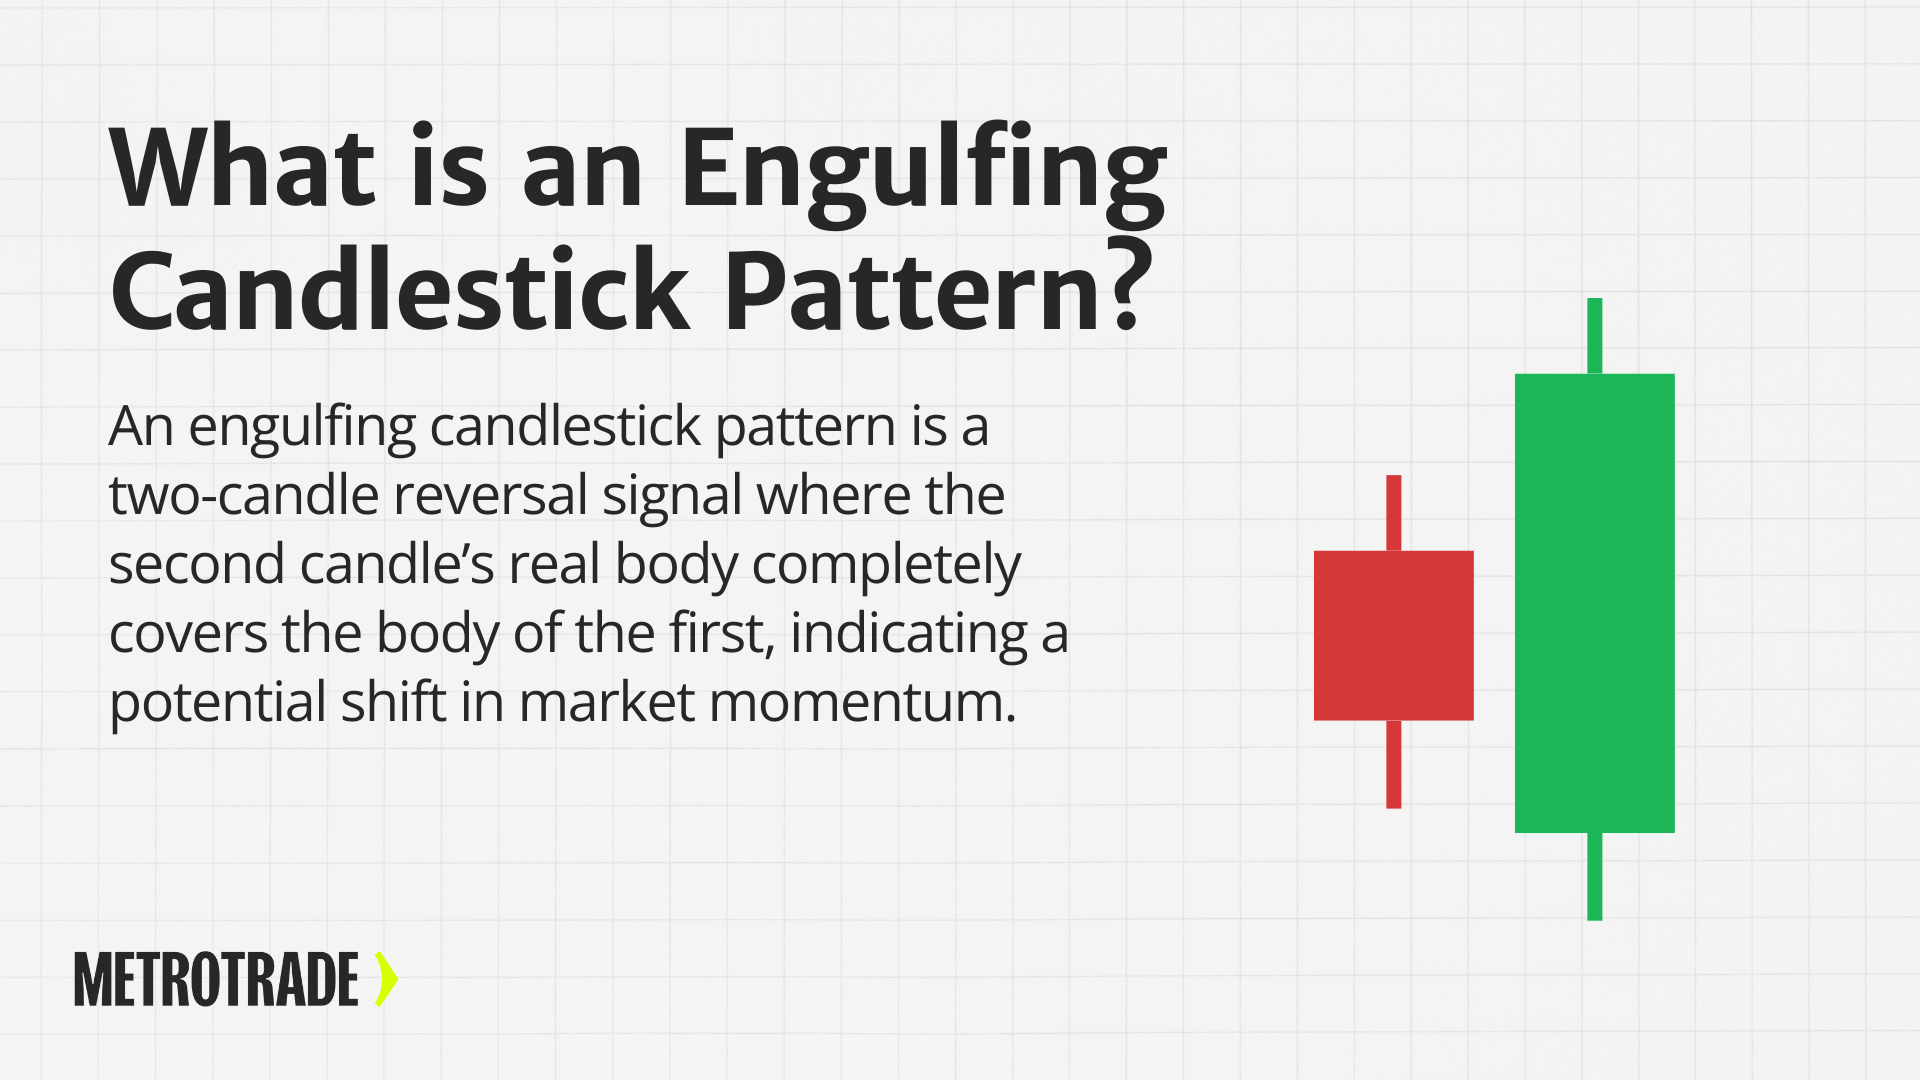
An engulfing candlestick pattern forms when a candle with a large real body fully covers or “engulfs” the body of the candle right before it. This second candle opens below (or above) the previous candle’s close and closes above (or below) its open, showing a complete shift in momentum.
The pattern is considered a strong reversal signal. It tells traders that the force driving the previous trend has been overtaken by the opposite side, either buyers or sellers.
Key characteristics of an engulfing candlestick:
- Two candles total
- The second candle’s body is larger and completely engulfs the first
- The wick or shadow is not as important; the real body matters more
- Found at the end of an uptrend (bearish engulfing) or downtrend (bullish engulfing)
While engulfing patterns can occur on any timeframe—from 1-minute charts to daily or weekly—they are more reliable on longer timeframes where there’s more market participation.
Types of Engulfing Candlestick Patterns

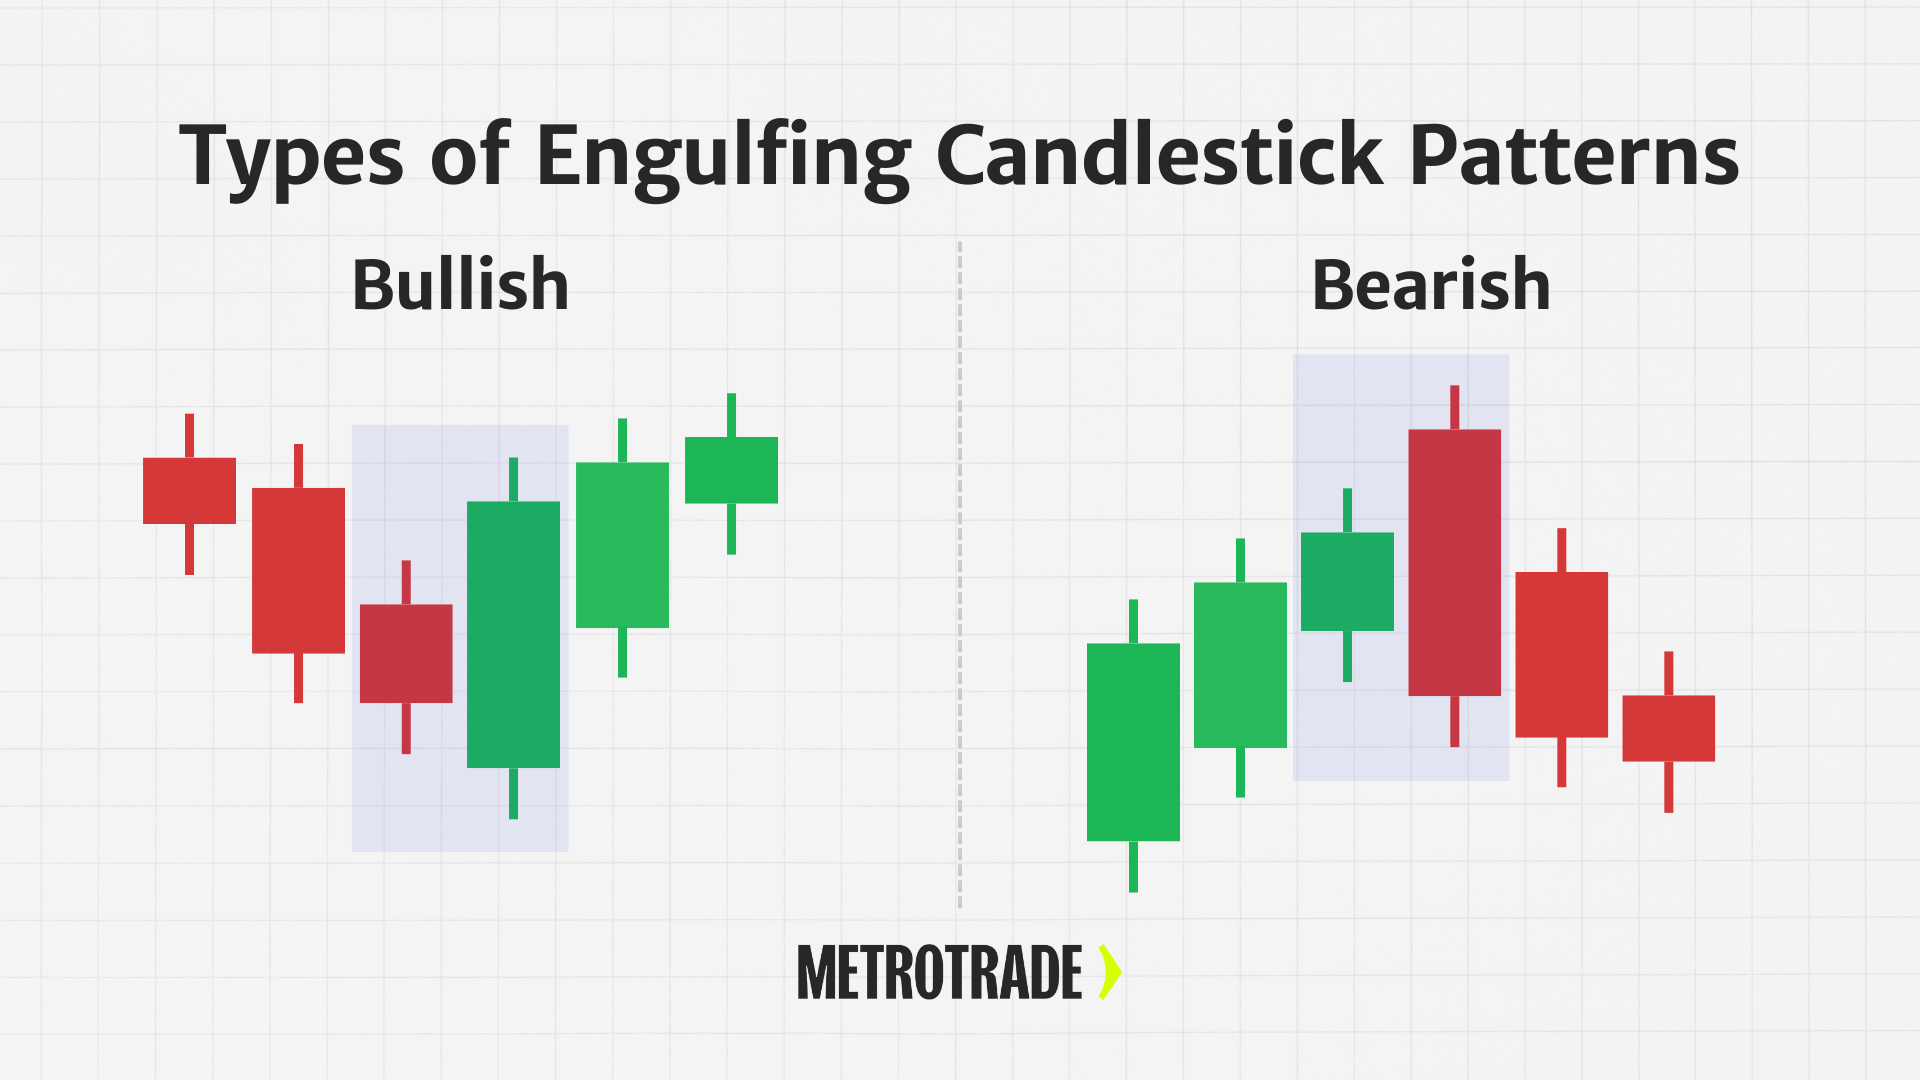
The engulfing candlestick pattern always involves two candles: the first represents the continuation of the existing trend, and the second shows a strong reversal attempt. While the general structure of the pattern stays the same, it can take two key forms depending on which direction the market is reversing: bullish or bearish.
Bullish Engulfing Pattern
A bullish engulfing pattern forms during a downtrend and suggests that buyers may be stepping in to reverse the selling pressure. It consists of two candles:
- The first candle is bearish (red or black), showing continued selling.
- The second candle is bullish (green or white), and its real body completely covers or “engulfs” the real body of the candle before it.
To qualify as a bullish engulfing:
- The second candle must open below the close of the first candle and close above its open.
- The bodies, not the wicks, must show full engulfment.
- Ideally, the pattern occurs after a meaningful downtrend, not just a minor pullback.
Why it matters:
This pattern tells us that sellers were initially in control, but buyers entered the market with enough strength to fully reverse the prior candle’s losses. The reversal doesn’t just pause the downtrend — it attempts to undo it with momentum. This shift in sentiment can catch short sellers off guard and trigger a new upward move, especially if other traders view the pattern as a signal to enter long positions.
Best-case scenario:
- The bullish engulfing pattern forms at a key support level.
- It’s accompanied by higher trading volume.
- The overall market is showing signs of a potential bottom.
In these cases, traders may view the pattern as a confirmation that the downtrend is exhausted, and a reversal could be underway.
Bearish Engulfing Pattern
A bearish engulfing pattern is the opposite. It forms during an uptrend and signals that sellers may be gaining control. The two-candle structure includes:
- A small bullish candle, showing continued buying.
- A larger bearish candle that opens above the first candle’s close and closes below its open, fully engulfing the body.
To qualify as a bearish engulfing:
- The second candle must have a real body that wraps around the entire body of the first candle.
- The pattern should appear after a period of upward price movement, ideally at or near a resistance level.
- The engulfing candle should close near its low, showing strong seller conviction.
Why it matters:
This pattern suggests that the buyers who had been driving the uptrend are losing strength. Sellers step in with enough pressure to erase the gains of the prior session and take control. That shift can create a reversal or at least a pullback, especially if the uptrend had become overextended.
Best-case scenario:
- The bearish engulfing forms near a known resistance zone.
- It happens after a strong, multi-day rally or parabolic move.
- It’s confirmed by declining volume on the rally and higher volume on the engulfing day.
In these situations, the bearish engulfing pattern can serve as a warning that the uptrend is weakening — and a potential exit or shorting opportunity may be forming.
Bullish vs Bearish Engulfing Candles
Engulfing patterns can signal reversals in either direction, depending on the type.
Bullish Engulfing Candlestick
- Appears during a downtrend
- First candle: small red (bearish)
- Second candle: large green (bullish) that opens lower and closes above the first candle’s high
- Suggests buyers have taken control, and the price may reverse upward
This pattern is strongest when it forms at a key support level or after a long decline. The sudden surge in buying power may attract momentum traders and short sellers covering their positions.
Bearish Engulfing Candlestick
- Appears during an uptrend
- First candle: small green (bullish)
- Second candle: large red (bearish) that opens higher and closes below the first candle’s low
- Suggests sellers have gained strength, and the price may begin to fall
Bearish engulfing patterns often appear near resistance zones or after an overextended rally. The larger red candle signals that sellers are stepping in and demand may be weakening.
Engulfing Candlestick vs Other Common Patterns
Understanding how engulfing patterns differ from other popular candlestick setups can help avoid confusion.
Engulfing vs Doji
A doji shows indecision—its open and close are nearly equal. In contrast, an engulfing pattern shows clear directional control. Dojis may precede a reversal, but engulfing candles often confirm it.
Engulfing vs Harami
A harami pattern is the opposite of an engulfing. The second candle is smaller and inside the first. It signals hesitation. The engulfing pattern, on the other hand, shows dominance by buyers or sellers.
Engulfing vs Dark Cloud Cover / Piercing Line
These two-candle reversal patterns share some features with engulfing setups. A dark cloud cover is a bearish reversal where the second candle partially overlaps the first. A piercing line is a bullish version. Engulfing patterns are stronger because the second candle fully covers the body of the first.
Engulfing vs Hammer
A hammer candle has a small body and a long lower wick. It appears after a downtrend and suggests a potential bullish reversal. While a hammer is a one-candle pattern, a bullish engulfing needs two candles and offers a stronger signal if confirmed.
Engulfing vs Hanging Man
The hanging man also has a small body and long lower wick but appears after an uptrend. It suggests weakening demand. A bearish engulfing pattern offers more confirmation of a top because it shows sellers have taken over completely.
How to Trade Using the Engulfing Candlestick Pattern
While the pattern alone can offer clues, trading decisions should always include context and risk management.
Here’s how traders typically use engulfing candles:
- Look for the pattern at the end of an extended move. A bullish engulfing should follow a decline; a bearish engulfing should follow a rally.
- Check for confluence. Patterns that form at support or resistance, trendlines, or Fibonacci levels tend to be more reliable.
- Wait for the engulfing candle to close before taking action. Jumping in early can lead to false signals.
- Use confirmation tools. Momentum indicators like RSI or MACD can help confirm a shift in trend direction.
Practicing with a demo account can help build confidence before risking real money.
Setting Up a Trade with Engulfing Patterns
Trading engulfing patterns takes more than just spotting the candle. You need a plan for entries, stops, and exits.
Entry Points
- Enter at the close of the engulfing candle or the open of the next candle
- More conservative traders wait for additional confirmation, such as a break of a nearby high or low
Stop Loss Placement
- For bullish setups, place a stop just below the low of the engulfing candle
- For bearish setups, place the stop just above the high
- Consider using the Average True Range (ATR) to adjust for volatility
Profit Targets
- Aim for a 1.5:1 or 2:1 reward-to-risk ratio
- Target nearby swing highs or lows, depending on direction
- Use trailing stops to lock in profits if the trend continues
Using Indicators for Confirmation
Indicators can help filter out weak setups.
- RSI: If RSI moves out of oversold (bullish) or overbought (bearish) territory, it may confirm the pattern
- MACD: A bullish crossover adds strength to bullish engulfing signals
- Volume: Higher volume during the engulfing candle can validate momentum
The more confirmation tools align, the stronger the setup.
Trade Futures with a Small Account
Start your live trading application and begin with margins as low as $80 per contract.
Pros and Cons of the Engulfing Candlestick Pattern
Pros
- Easy to identify on charts: Engulfing patterns stand out visually and don’t require complex indicators, making them accessible for beginners.
- Works across all markets and timeframes: This pattern can appear on intraday, daily, or weekly charts in any asset class, including futures, stocks, and forex.
- Highlights key turning points in price action: The strong shift between the first and second candle often marks a meaningful change in market sentiment.
- Can be used to confirm other signals: When it appears near support, resistance, or alongside volume spikes, the pattern can add confidence to trade setups.
Cons
- Less reliable in sideways or low-volume markets: Without a clear trend or strong participation, engulfing patterns may fail to produce follow-through.
- Not effective when used alone: Relying on the pattern without context or confirmation can lead to false signals and poor timing.
- Interpretation can be subjective: Some traders may disagree on what qualifies as a full engulfing, especially when candle sizes are similar.
- Confirmation may come after the best entry point: By the time the pattern closes, part of the reversal move may already have occurred, reducing profit potential.
Common Mistakes to Avoid
- Trading the pattern in isolation: Relying only on the engulfing pattern without support from trendlines, volume, or indicators can lead to low-probability trades.
- Entering before the pattern confirms: Jumping in before the engulfing candle closes increases the risk of false signals or premature entries.
- Ignoring the broader trend: Taking a bullish engulfing in a strong downtrend, or a bearish one in a strong uptrend, often leads to failed setups.
- Forgetting to manage risk: Skipping stop losses or trading with poor risk-to-reward ratios can quickly turn a good setup into a costly mistake.
- Misidentifying candle structure: Patterns where the second candle does not fully engulf the real body of the first should not be treated as valid engulfing setups.
- Overtrading every engulfing pattern: These patterns are common, but not every one is worth trading. Quality matters more than quantity.
Final Thoughts
The engulfing candlestick pattern is one of the most trusted tools for spotting potential market reversals. It’s easy to recognize and works across all markets and timeframes. But like any pattern, it should not be used on its own. Success comes from combining engulfing candles with key levels, technical indicators, and sound risk management.
For beginner traders, it’s wise to study these patterns in a demo environment before using them in live markets. The more you see them play out in real time, the easier it becomes to act with confidence.
FAQs
What is an engulfing candlestick pattern in trading?
An engulfing candlestick pattern is a two-candle formation where the second candle’s real body fully covers the first candle’s body. It signals a potential reversal in market direction and is used by traders to identify shifts in momentum.
How do you identify a bullish engulfing candle?
A bullish engulfing candle appears after a downtrend. It forms when a small bearish candle is followed by a larger bullish candle that opens lower and closes above the previous candle’s high, fully engulfing its body.
What does a bearish engulfing candlestick indicate?
A bearish engulfing candlestick appears after an uptrend and signals a potential reversal to the downside. It forms when a small bullish candle is followed by a larger bearish candle that completely engulfs it.
Is the engulfing candlestick pattern reliable?
The engulfing candlestick pattern can be reliable when it forms at key support or resistance levels and is confirmed by volume or indicators. However, it should not be used in isolation.
What timeframe works best for engulfing patterns?
Engulfing candlestick patterns are most reliable on higher timeframes, such as the 4-hour or daily chart, where market noise is reduced and trends are more clearly defined.
What indicators work well with engulfing candlestick patterns?
Common indicators used with engulfing candlestick patterns include RSI, MACD, and volume. These tools help confirm momentum and increase the pattern’s reliability.
The content provided is for informational and educational purposes only and should not be considered trading, investment, tax, or legal advice. Futures trading involves substantial risk and is not suitable for every investor. Past performance is not indicative of future results. You should carefully consider whether trading is appropriate for your financial situation. Always consult with a licensed financial professional before making any trading decisions. MetroTrade is not liable for any losses or damages arising from the use of this content.


