In futures trading and technical analysis, candlestick patterns give traders visual clues about market sentiment. Among these patterns, the doji candle stands out for what it doesn’t say: certainty. Instead, the doji signals indecision, hesitation, or a possible turning point in price direction.
But what exactly is a doji candle? How does it form, and how can traders use doji candle patterns in their futures trading strategy?
This guide breaks it all down with plain explanations, chart examples, and practical insights you can apply to your analysis.
Key Takeaways
- A doji candle signals indecision in the market, forming when a futures contract opens and closes at nearly the same price.
- There are multiple types of doji patterns, including standard, long-legged, dragonfly, and gravestone, each with its own potential implications.
- Doji candles are most useful when combined with context, such as trend direction, support and resistance levels, or volume shifts.
- Traders use dojis to identify potential reversals or pauses, but always wait for confirmation before making decisions.
What Is a Doji Candle?

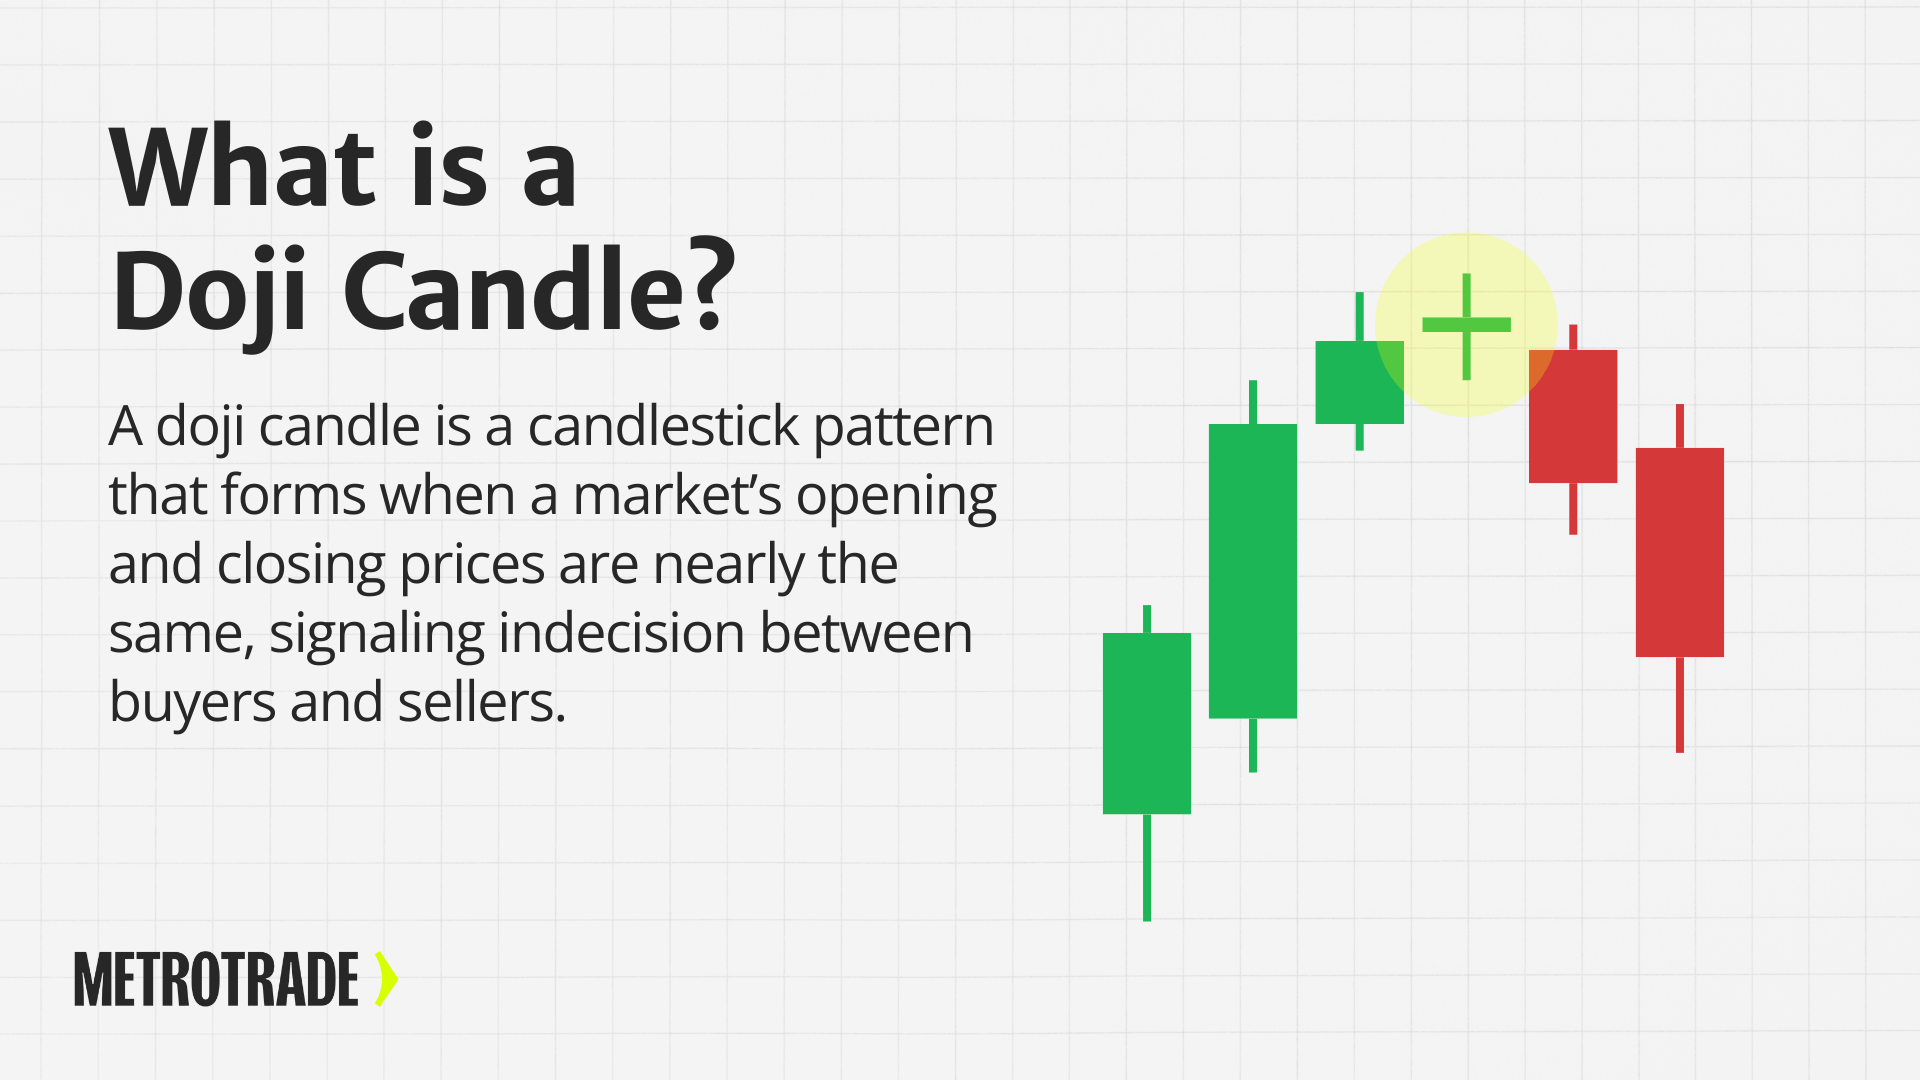
A doji candle is a type of candlestick pattern that shows up when the market opens and closes at nearly the same price. It represents a standoff between buyers and sellers—neither side has gained control by the end of the session.
Unlike bullish or bearish candles, which have clear direction, a doji reflects indecision. It doesn’t point to a strong move either way but instead signals that momentum may be shifting or stalling. That makes it an important visual clue for traders analyzing chart behavior.
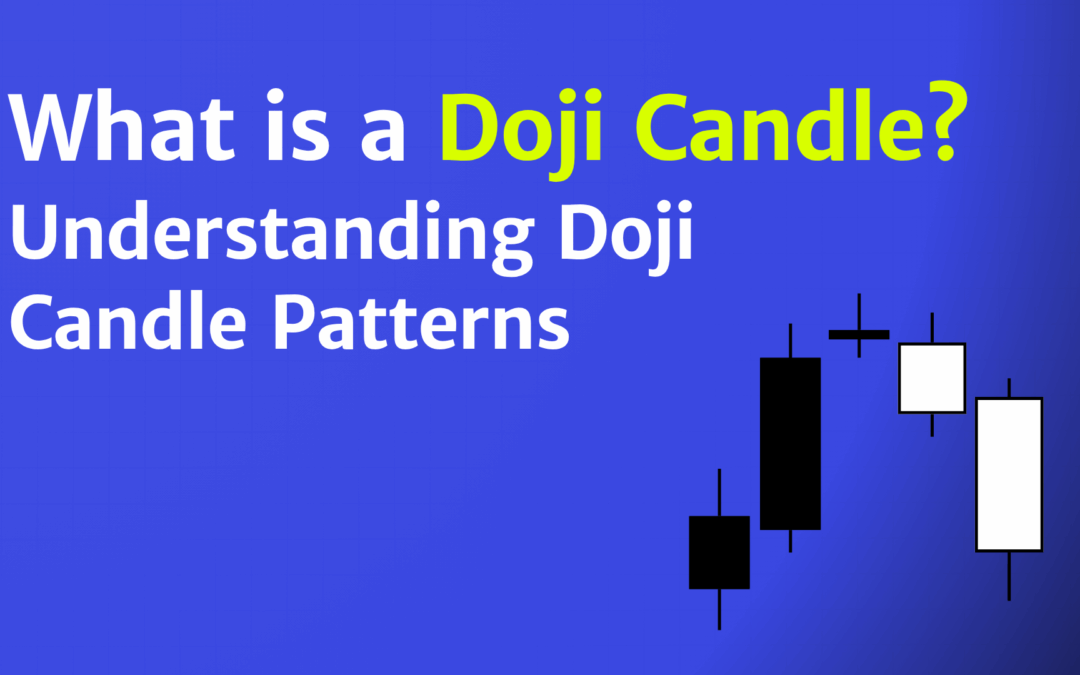
On a candlestick chart, the doji is easily recognized by its narrow or nonexistent body. The candle may have upper and lower wicks of varying lengths, depending on how the price moved during the session.
A doji forms when:
- The open and close prices are nearly identical
- The candle’s real body appears flat or very small
- Wicks (shadows) show how far the price moved above and below the open
- Neither buyers nor sellers dominate the price action
Doji candles can appear on any timeframe—whether you’re looking at 1-minute, hourly, or daily charts. Regardless of when they form, they tell the same story: the market is pausing to decide what comes next.
While a single doji isn’t a trade signal on its own, it often serves as a warning flag or setup clue in futures trading, especially when it appears at key levels or after a strong trend.
Anatomy of a Doji Candle

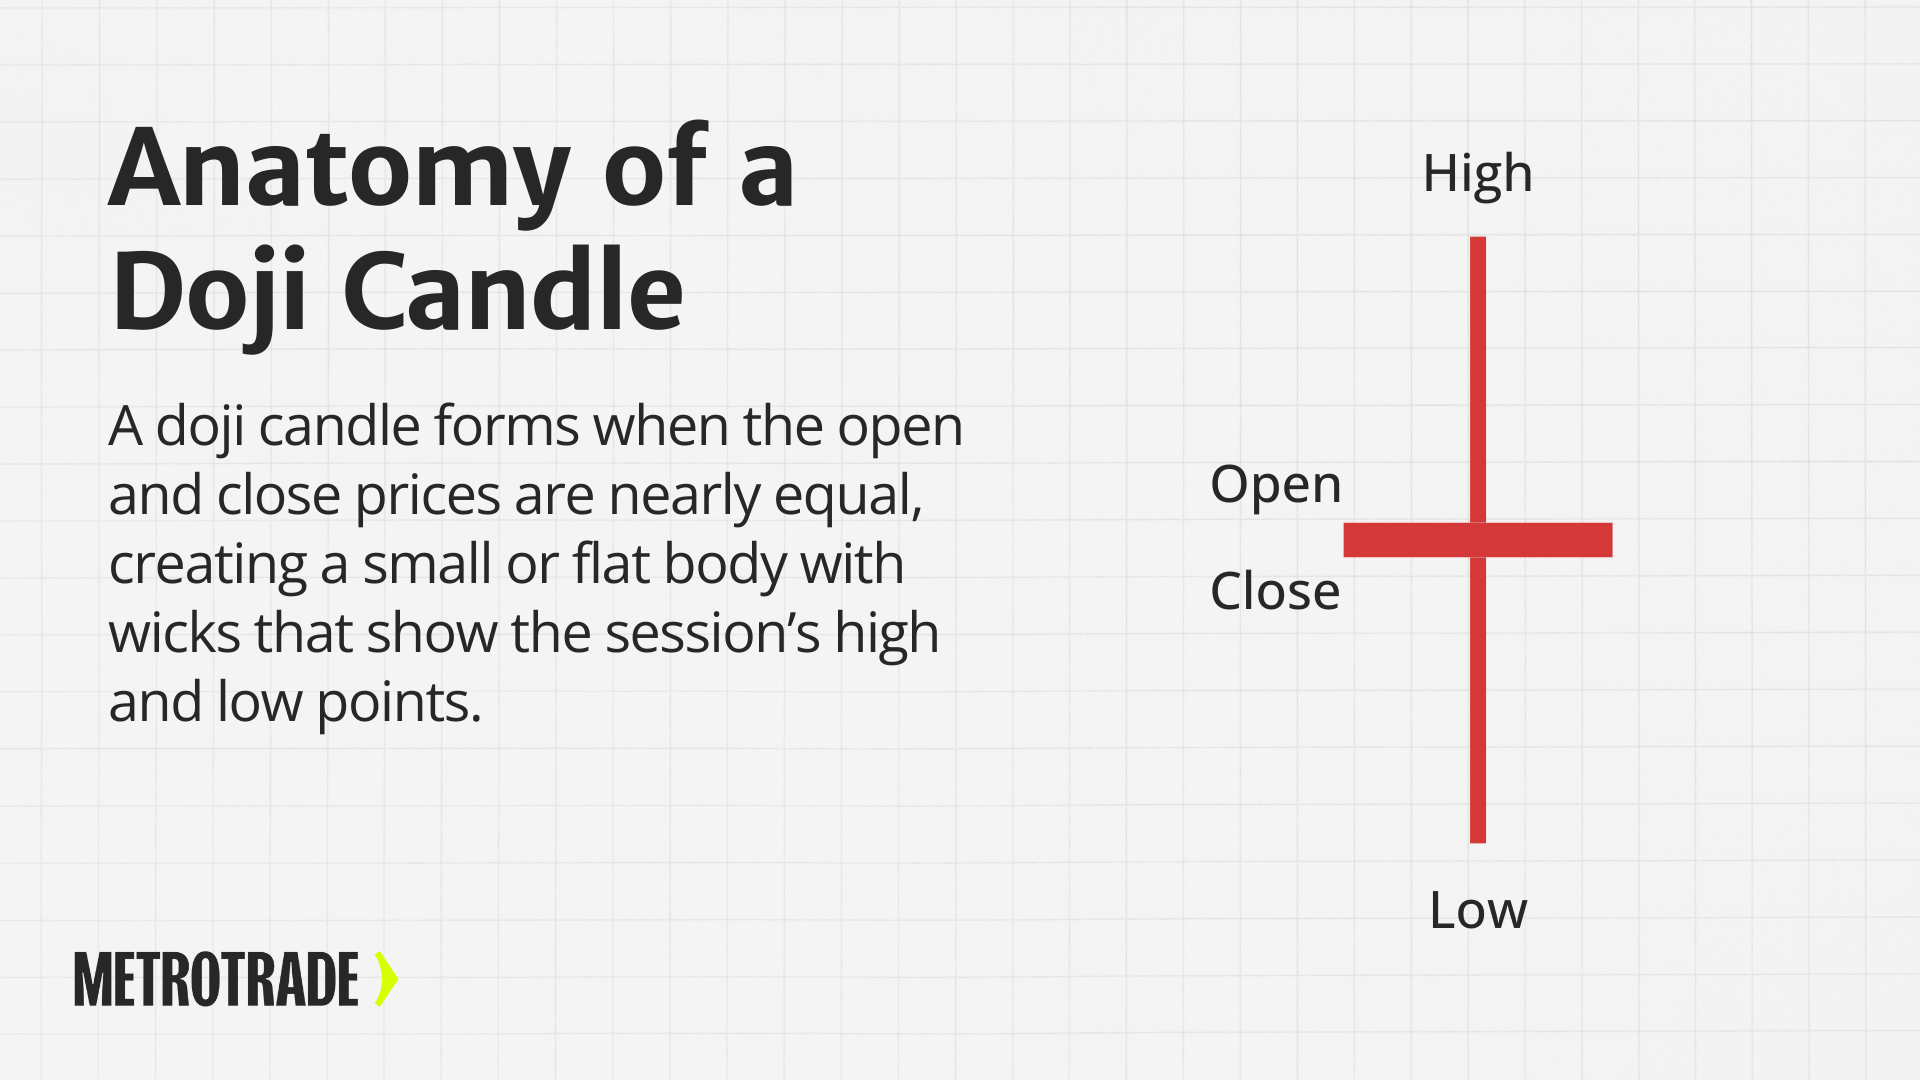
To fully understand what a doji candle represents, it helps to break down its structure. Like all candlesticks, a doji shows the relationship between the open, high, low, and close prices of a given trading period. But unlike other candles, the doji has almost no real body, which makes it unique.
What makes the doji different is that the open and close prices are virtually equal, meaning neither bulls nor bears were able to push the price in their favor by the end of the session. This lack of progress creates the doji’s signature “cross” or “plus sign” appearance.
The key parts of a doji candle include:
- Open price: The level at which the trading session began
- Close price: The level where the session ended—usually right at or near the open
- Upper wick (shadow): The highest price reached during the session
- Lower wick (shadow): The lowest price reached during the session
- Real body: The small or nonexistent portion between the open and the close
Because of the small body and visible wicks, doji candles can resemble a cross, a plus sign, or even a T-shape depending on price action.
Doji candles can show up on any time frame, from intraday charts to daily or weekly charts. While the pattern itself is simple, its meaning depends heavily on where it appears in the broader trend.
What Does a Doji Candle Mean?
A doji candle signals market indecision. It shows that neither the bulls nor the bears could gain control during the session. As a result, the price ends up closing right where it opened or very close to it.
In Technical Terms:
- Buyers pushed the price up
- Sellers pushed it down
- Both sides ended at a standstill
This balance of power creates a pause. Sometimes that pause leads to a reversal. Other times, it just means the market is taking a breath before continuing the trend.
For futures traders, the message is: “Pay attention. Something may be shifting.”
Types of Doji Candle Patterns

Not all dojis look or behave the same. While every doji shares the same core feature—an open and close price that are nearly equal—the shape of the wicks and where the candle appears in a trend can change its meaning.
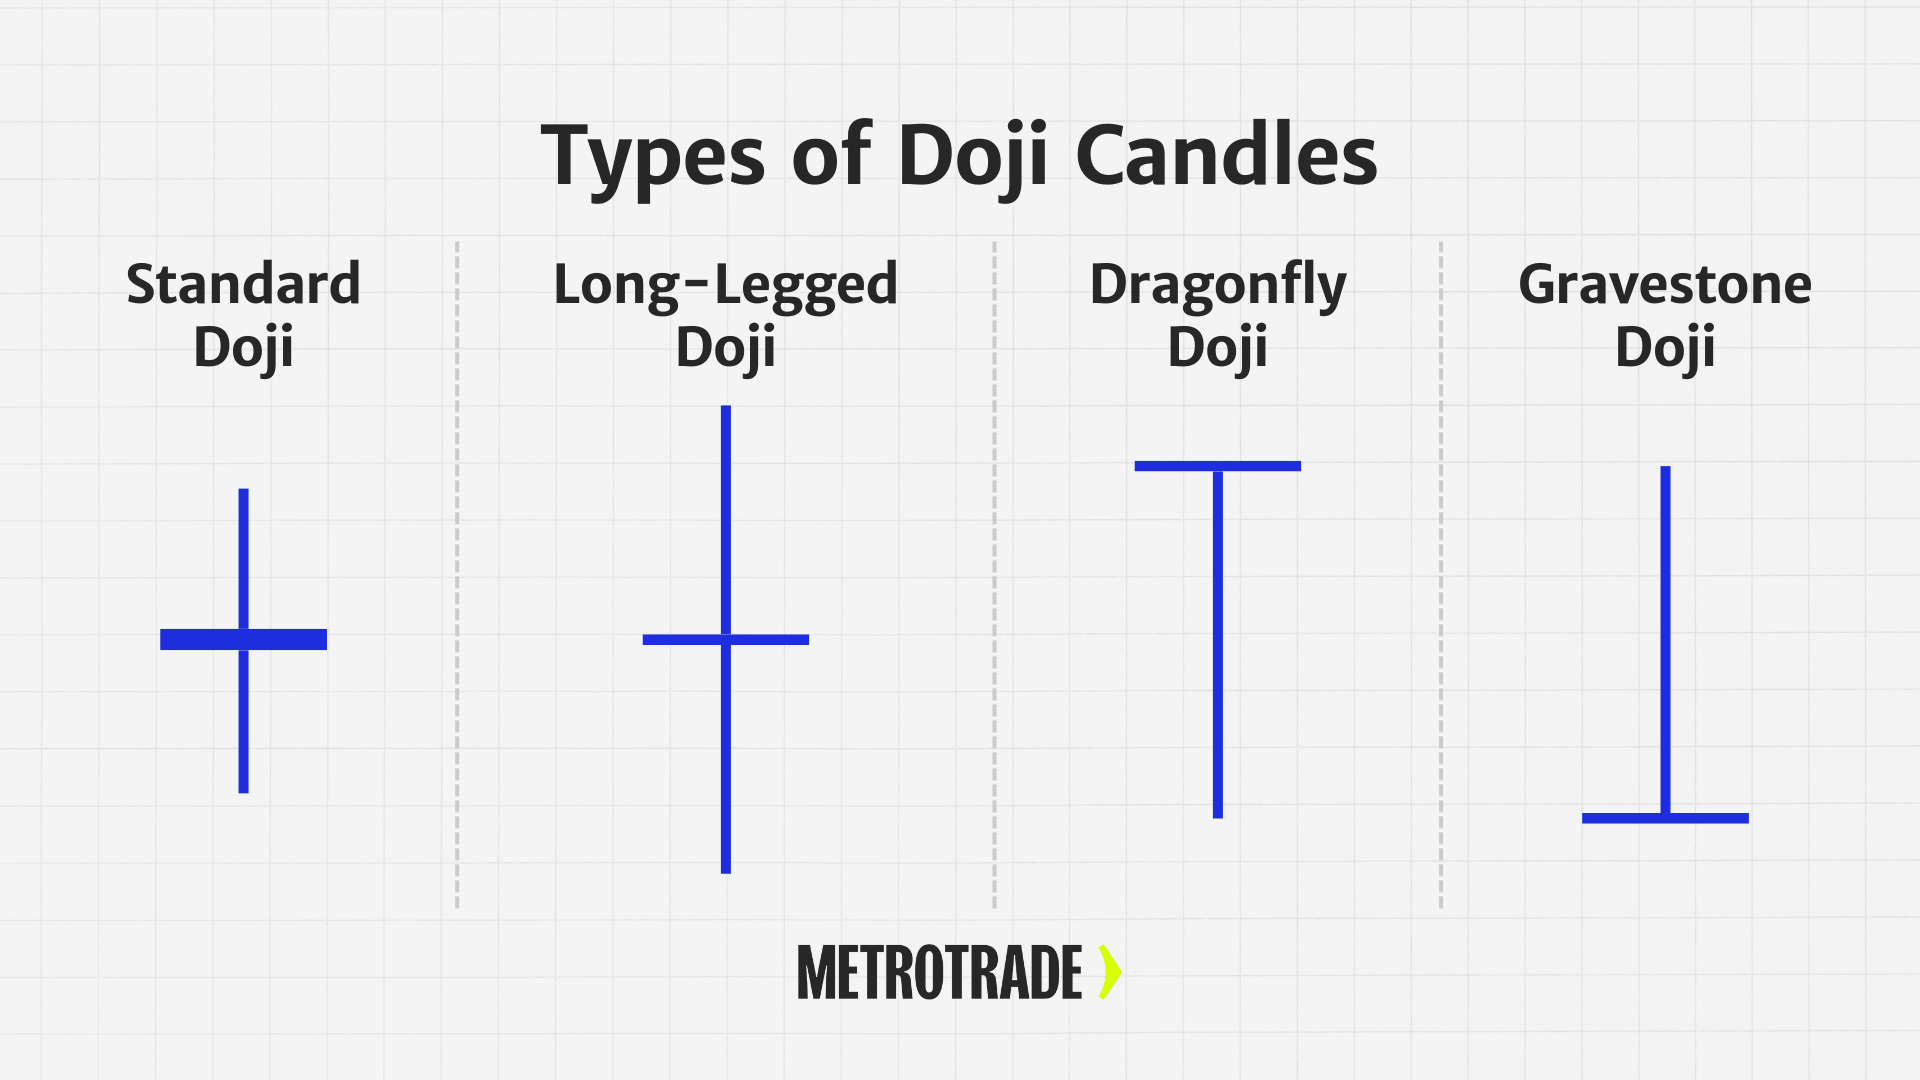
Below are the four most common types of doji candle patterns traders encounter on futures charts.
Standard Doji
The standard doji is the most basic version of the pattern. It appears as a symmetrical cross, with the open and the close nearly identical and relatively short wicks on both ends. This type of doji often shows up in periods of low volatility or when the market is consolidating.
It typically signals neutral sentiment and may not lead to any major move unless it forms near a key level or after a strong trend.
What it suggests:
- The market is balanced between buyers and sellers
- There’s no strong conviction on either side
- A possible pause or continuation of the current trend
- Watch for confirmation from the next candle or volume spike
Long-Legged Doji
A long-legged doji has longer upper and lower wicks, showing that the price moved significantly in both directions during the session before closing near where it opened. This pattern signals a higher level of uncertainty and indecision than a standard doji.
Because of the wider range of price movement, it often forms during volatile periods or at critical decision points in the market.
What it suggests:
- Significant back-and-forth between bulls and bears
- Uncertainty about future direction
- Possible breakout or reversal when followed by a strong candle
- Traders should look to volume or key support/resistance for confirmation
Dragonfly Doji
The dragonfly doji is a bullish variation of the pattern. It forms when the open, close, and high prices are all at or near the same level, and there’s a long lower wick. This shape shows that sellers drove the price down, but buyers stepped in and pushed it back up to close near the high.
Dragonfly dojis are more meaningful when they appear after a downtrend, as they can signal a potential reversal or a bottom forming.
What it suggests:
- Strong intraday rejection of lower prices
- Buyers regained control by the close
- Bullish reversal signal, especially with volume confirmation
- Best used near support levels or after extended selling
Gravestone Doji
The gravestone doji is the opposite of the dragonfly. It forms when the open, close, and low prices are near the same level, and the upper wick is long. This pattern shows that buyers pushed the price higher during the session, but sellers overwhelmed them and drove it back down to the open.
Gravestone dojis are often seen near the top of an uptrend and can serve as a bearish warning.
What it suggests:
- Rejection of higher prices
- Bearish pressure increased into the close
- Potential reversal if confirmed by the next candle
- Watch for this pattern near resistance or after a sharp rally
Doji Candle vs Spinning Top
At first glance, a doji candle and a spinning top may look similar. Both patterns have small real bodies and suggest a degree of indecision in the market. However, there are important differences between the two that traders should recognize.
A doji forms when the open and close prices are virtually the same, creating a candle with a flat or non-existent body. This reflects a perfect balance between buyers and sellers, with neither side gaining ground. The message is one of clear indecision.
A spinning top, on the other hand, has a small but noticeable body. The open and close are close to each other, but not equal. It often comes with wicks on both sides, showing that price moved in both directions during the session. While it also suggests indecision, it implies that there was some momentum in the session, even if it didn’t last.
In short:
- A doji represents pure indecision, where no progress is made.
- A spinning top shows weak momentum or balance, but with a bit more directional movement.
Understanding this distinction can help traders better gauge the strength of a potential signal, especially when analyzing price action near support or resistance zones.
How to Interpret a Doji Candle in Futures Trading
A doji candle doesn’t predict direction by itself; it reflects hesitation in the market. The meaning depends on where it forms within the broader trend and what follows it.
Doji in an Uptrend
When a doji appears after several bullish candles, it can indicate that buyers are losing strength. If the next candle closes lower, it often signals a potential trend reversal or short-term pullback.
Doji in a Downtrend
A doji forming after a string of bearish candles can suggest that selling pressure is fading. Traders watch for a bullish candle afterward as confirmation that a reversal or recovery may be starting.
Doji in a Sideways Market
When the price is moving within a range, a doji simply confirms market indecision. It may precede a breakout if momentum starts to build, but by itself, it’s not a strong signal to trade.
Reading the Follow-Up Candle
The candle that comes after the doji is what gives it meaning. A strong bullish or bearish close confirms which side has gained control and helps validate the setup.
Put Your Trading Strategies to the Test
Start your live trading application and begin with margins as low as $80 per contract.
Doji Patterns in Popular Technical Setups
Doji candle patterns often play a role in broader technical setups, adding context to existing signals. Traders use them to reinforce decisions around entries, reversals, or breakouts.
Doji with Support or Resistance
When a doji forms near a key support or resistance level, it can confirm that the market is testing that boundary. A strong candle breaking away from the level afterward provides a clearer directional cue.
Doji with Trendlines
A doji appearing on or near a trendline suggests the market is deciding whether to respect or break that trend. A confirmed breakout candle following the doji can mark a momentum shift.
Doji with RSI Divergence
If the Relative Strength Index (RSI) shows divergence while a doji forms, it adds weight to a possible trend reversal. Traders often use this confluence to strengthen their confidence before entering a trade.
Doji in Multi-Candle Patterns
Dojis sometimes appear within multi-candle setups like the Morning Star or Evening Star. In these patterns, the doji represents a pause before the next strong move, helping confirm the market’s transition.
Entry Signals Based on Doji Patterns
While dojis are not entry signals by themselves, traders often use them in setups that include:
- Confirmation candles: A strong bullish or bearish candle after the doji
- Key levels: Support/resistance zones or trendlines
- Indicators: Volume, RSI, MACD, or moving averages
Example:
- A dragonfly doji forms after a downtrend near support
- The next candle closes strong and green
- This confirmation signals a potential long entry
Stop Loss Placement with Doji Patterns
Managing risk is critical when trading doji candle patterns. Here’s how traders approach stop placement:
- Just beyond the wick: Place the stop above or below the longest shadow of the doji
- Structure-based: Use recent swing highs/lows as logical stop levels
- Volatility-based: Use the Average True Range (ATR) to set a dynamic stop that adjusts to market conditions
Never set stops too close. Markets often test wicks before moving in the expected direction.
Profit Targets and Exit Strategies
Once a doji candle setup is confirmed, traders should focus on how to manage the trade and plan their exits. Clear profit targets and disciplined exit strategies help capture gains while limiting emotional decision-making.
- Use risk-to-reward ratios: Before entering any trade, define a minimum risk-to-reward ratio (commonly 2:1). This means aiming to make twice as much profit as you’re willing to risk, which helps maintain consistency over time.
- Target prior swing highs or lows: When trading reversals based on doji patterns, previous swing highs or lows often make logical profit targets. These levels act as natural points of resistance or support where the price may hesitate or reverse again.
- Use trailing stops to protect profits: A trailing stop allows you to lock in gains as the market moves in your favor. As price advances, adjust your stop gradually to follow the trend and protect profits without closing the trade too early.
- Let indicators confirm your exit: Momentum tools like RSI, MACD, or moving averages can help confirm when a move is losing strength. Exiting when these indicators flatten or cross back can help you secure profits before the market changes direction.
- Avoid overextending trades: Dojis often signal uncertainty, not sustained momentum. Once your profit target is reached or the market begins to stall, it’s usually better to close the position and look for the next setup rather than forcing extra gains.
Pros and Cons of Using Doji Candle Patterns
Like most technical indicators, the doji candle pattern has both strengths and limitations. Understanding these can help traders use them more effectively within a complete trading strategy.
Pros
- Easy to identify: The doji’s flat or cross-shaped body makes it instantly recognizable, even for new traders learning to read charts.
- Reveals market indecision: It clearly shows when buyers and sellers are evenly matched, signaling potential turning points in sentiment.
- Works across time frames: Whether you trade on 5-minute or daily charts, the doji carries the same meaning and can be applied consistently.
- Adds context to other tools: When combined with volume, RSI, or support and resistance, a doji can strengthen the accuracy of your analysis.
Cons
- Generates frequent false signals: Dojis appear often, especially in choppy markets, and many of them don’t lead to meaningful reversals.
- Requires confirmation: Acting on a doji alone can be risky; traders need supporting evidence from the next candle or other indicators.
- Loses value in sideways markets: When the price is already range-bound, dojis simply echo indecision and provide little actionable insight.
- Not a complete strategy: A doji is a signal, not a system. It works best as part of a broader plan that includes risk management and trade confirmation.
Tools for Spotting Doji Candle Patterns
Most modern charting platforms include built-in candlestick scanners or allow for custom indicator settings to highlight dojis. You can also spot them manually.
On MetroTrader, you can use:
- Advanced candlestick charting
- Drawing tools to mark support and resistance zones
- Customizable indicators to add confluence to your setups
Practicing in demo mode can help you spot and react to doji patterns without risk.
Try MetroTrader free for 30 days
Common Mistakes with Doji Candle Patterns
Avoid these errors when using doji candles:
- Trading without confirmation: Jumping in after a doji without a follow-up candle is risky
- Ignoring context: A doji in isolation is meaningless; always look at the trend and location
- Forcing signals: Not every cross-shaped candle is a doji
- Overtrading: Seeing too many dojis and acting on all of them leads to noise
Discipline and patience are your best tools when working with any candlestick pattern.
Doji Candle Patterns in Real Charts (With Examples)
Let’s walk through a few real-world examples of how doji candles appear on futures charts:
Example 1: Dragonfly Doji After a Downtrend
- Market: Crude oil futures
- Price forms a long lower wick with open and close near the high
- Followed by a strong bullish candle
- Result: Uptrend begins with several green candles
Example 2: Gravestone Doji Near Resistance
- Market: S&P 500 E-mini
- Price rallies into resistance and prints a long upper wick doji
- The next candle is bearish
- Result: Price reverses sharply
Example 3: Long-Legged Doji at Breakout Level
- Market: Gold futures
- Price stalls at the breakout point with long wicks in both directions
- Next candle breaks out with volume
- Result: Sharp upward move
Each of these setups shows the importance of combining the doji with confirmation and support factors.
Conclusion
The doji candle pattern is a powerful visual signal in technical analysis. It doesn’t promise direction; it highlights uncertainty. And in trading, recognizing uncertainty is often just as important as spotting conviction.
Whether you’re watching for a trend reversal, gauging market sentiment, or looking to refine your entry timing, learning to identify and interpret doji candles can sharpen your edge.
But always remember: context is everything. Combine the doji with proper support/resistance analysis, confirmation candles, and risk management tools to make it work for you.
Want to practice spotting doji candles risk-free?
Sign up for a free demo account on MetroTrader and put your analysis skills to the test.
FAQs About Doji Candle Patterns
What is a doji candle in trading?
A doji candle is a candlestick pattern where the opening and closing prices are nearly equal, forming a flat or cross-shaped body that signals indecision between buyers and sellers.
What does a doji candle mean in futures trading?
In futures trading, a doji candle indicates that market participants are evenly balanced, which can signal a possible reversal, pause, or continuation depending on the next candle and surrounding context.
Is a doji candle bullish or bearish?
A doji candle is neutral by itself. It becomes bullish or bearish only after confirmation from the following candle, showing which side—buyers or sellers—has taken control.
What are the main types of doji candle patterns?
The main types of doji patterns are the standard doji, long-legged doji, dragonfly doji, and gravestone doji. Each variation has a unique shape and can carry different implications depending on the trend and position.
How do traders use the doji candle pattern?
Traders use doji candle patterns to identify moments of indecision and potential reversals. They often wait for a confirmation candle or volume signal before entering a position.
What’s the difference between a doji and a spinning top?
A doji has an open and a close that are nearly identical, showing total indecision. A spinning top has a small but visible body, suggesting mild momentum in either direction.
The content provided is for informational and educational purposes only and should not be considered trading, investment, tax, or legal advice. Futures trading involves substantial risk and is not suitable for every investor. Past performance is not indicative of future results. You should carefully consider whether trading is appropriate for your financial situation. Always consult with a licensed financial professional before making any trading decisions. MetroTrade is not liable for any losses or damages arising from the use of this content.


