Candlestick patterns help traders make sense of price action on a chart. Among the many formations, the hanging man candlestick stands out as a simple yet powerful tool for spotting potential trend reversals at the top of a rally.
If you’re new to technical analysis, this guide will walk you through what a hanging man candlestick is, how it forms, what it means, and how to use it in real-world trading, especially in futures markets.
Key Takeaways
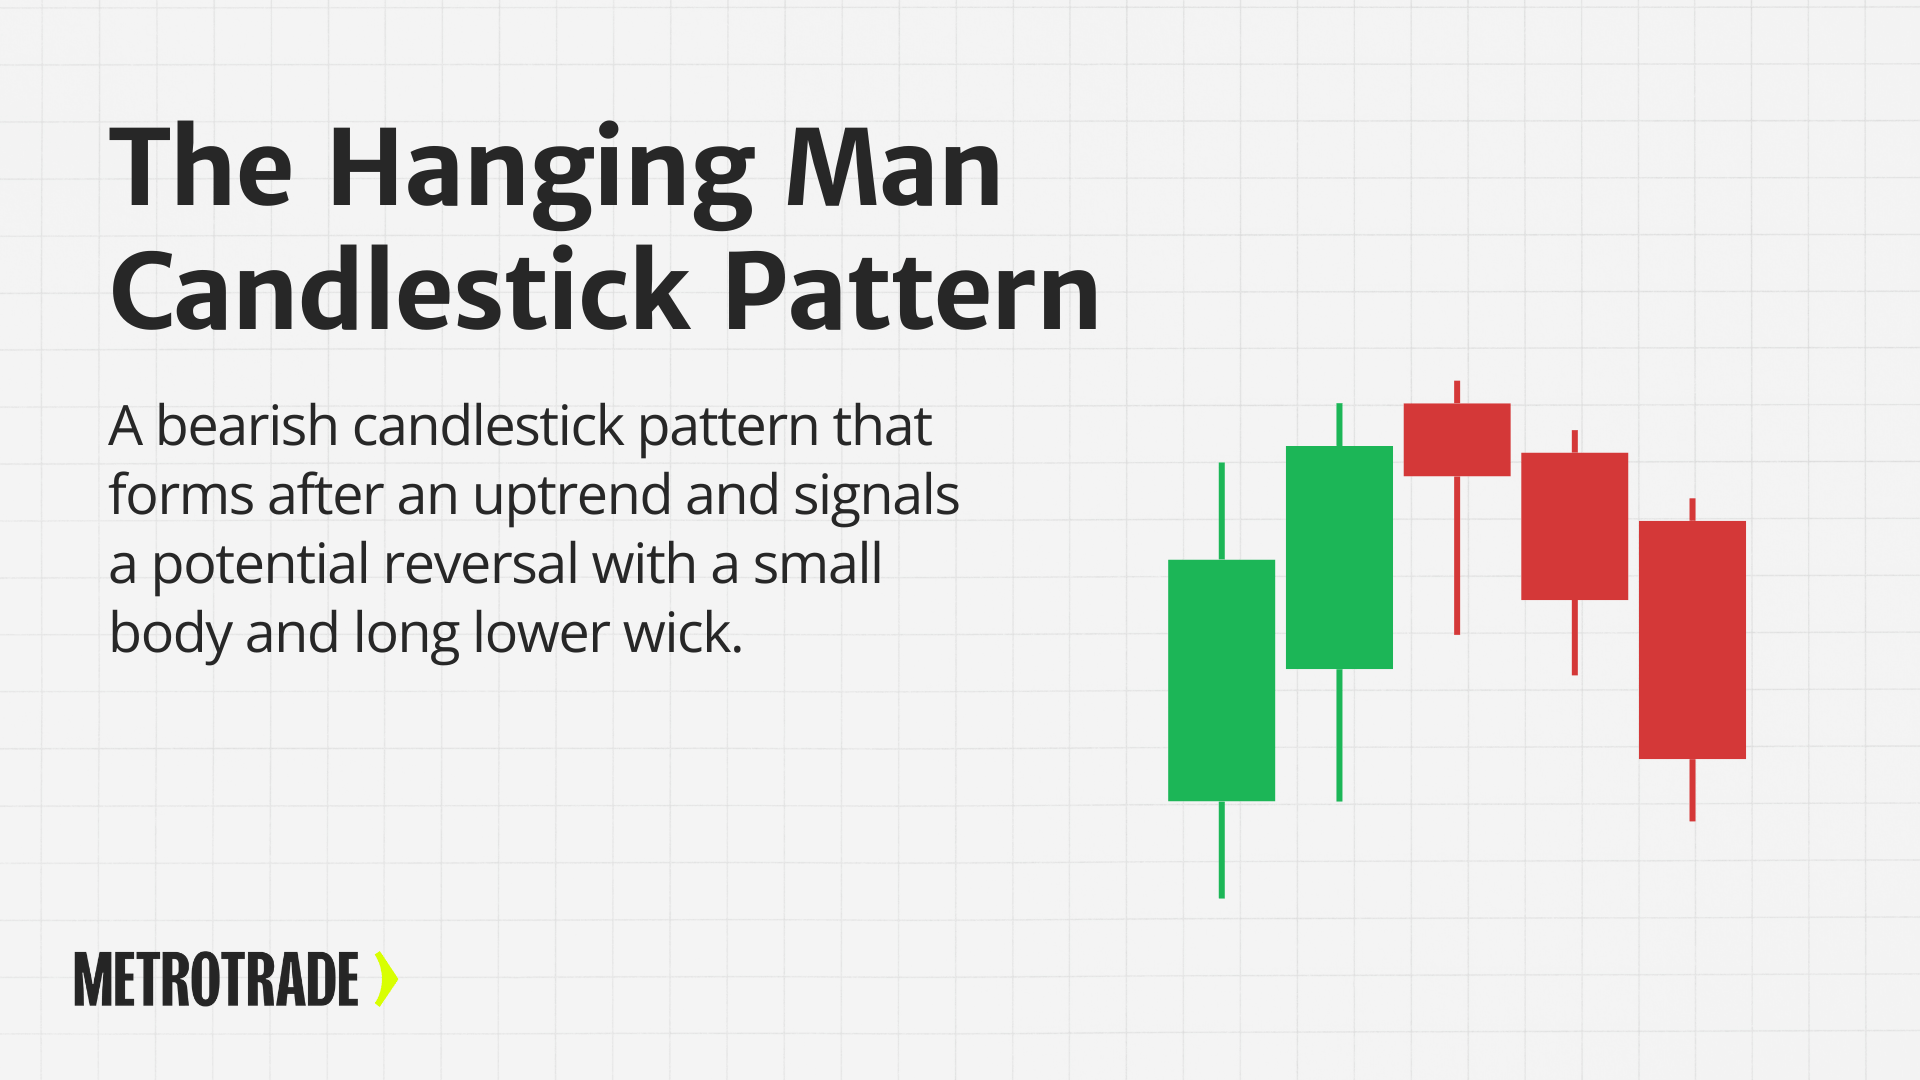
- The hanging man candlestick pattern signals a potential bearish reversal when it appears after an uptrend, showing sellers may be gaining control.
- Its structure includes a small real body near the top and a long lower wick, which reflects intraday selling pressure that was met with a late-session recovery.
- Confirmation from the next candle and volume context increases reliability, helping traders avoid false signals and manage risk more effectively.
- Hanging man patterns are widely used across futures markets and work best when combined with resistance levels, trend context, and supporting technical indicators.
What Is the Hanging Man Candlestick Pattern?

The hanging man candlestick is a single-bar bearish reversal pattern that forms after an uptrend. It suggests that buying pressure may be weakening and that sellers are starting to step in. The name comes from its shape, which resembles a hanging figure: a small body near the top of the range and a long lower wick that shows the price was driven down intraday but recovered.
Traders look for hanging man candles because they often mark the first sign of exhaustion at the top of a move. While the pattern itself is simple, its meaning depends heavily on context. A hanging man tells the story of a market that tried to sell off but was pulled back up, possibly as a last gasp before a reversal lower.
When paired with confirmation from the next candle or other technical tools, the hanging man can offer an early signal of a potential top.
Anatomy of a Hanging Man Candle

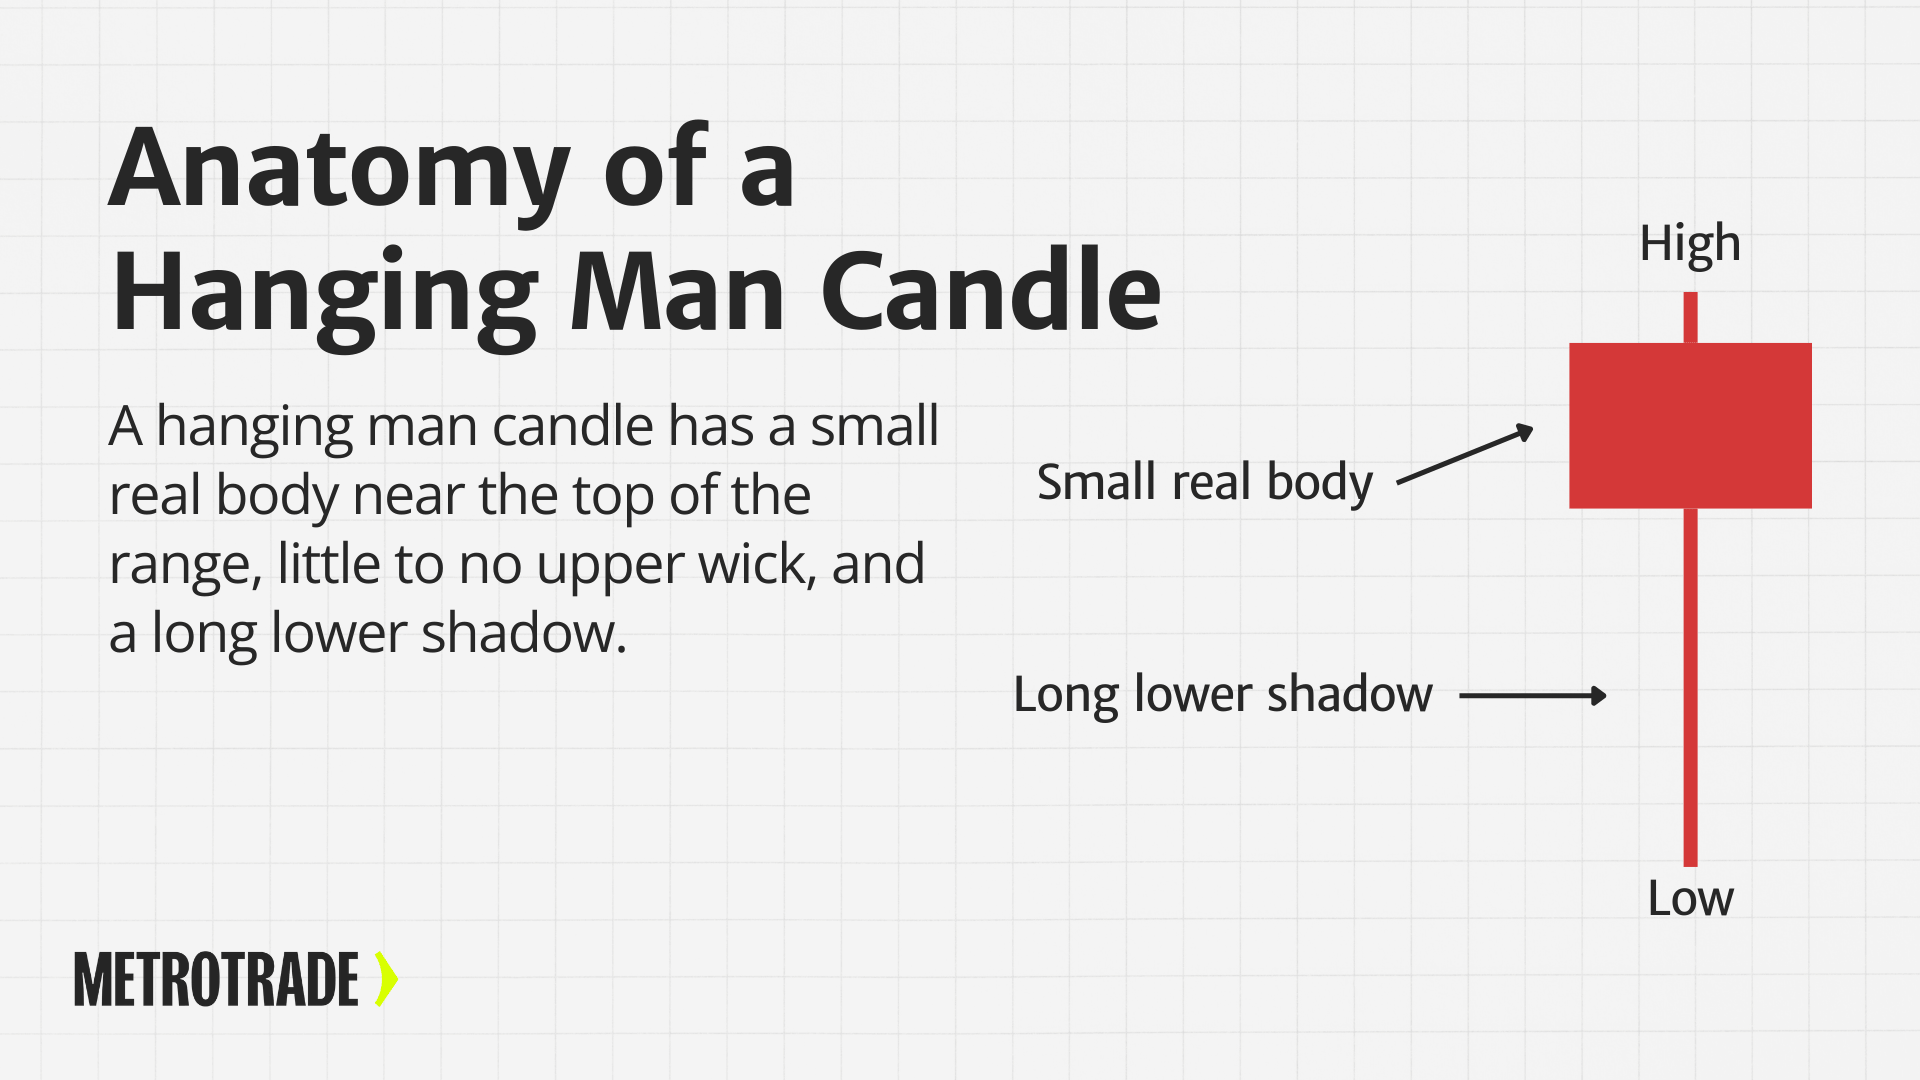
A proper hanging man has three defining features:
- Small Real Body: Located near the top of the candle’s range. The color can be red (bearish) or green (bullish), but red is often considered a stronger signal.
- Long Lower Shadow: The lower wick should be at least twice the height of the real body. This shows how far sellers were able to push prices down before buyers stepped back in.
- Little to No Upper Shadow: A small upper wick or none at all suggests buyers didn’t push the price much higher after the open.
This structure is key. Without the long lower wick, it’s not a hanging man; it’s just a normal candle.
Where the Hanging Man Appears: Context Matters
The hanging man candlestick pattern is only effective when it forms in the right context. Many beginners make the mistake of spotting a long lower wick and calling it a hanging man without checking its location on the chart. But the placement of the pattern is what gives it meaning.
A hanging man only matters after an uptrend.
For the pattern to suggest a potential reversal, it needs to follow a clear price rally. The pattern reflects a possible loss of bullish momentum, so if there’s no prior uptrend, there’s no trend to reverse.
For example:
- If price has been rising steadily for several days or weeks and a hanging man forms near a key resistance level, it may indicate that buying is slowing and sellers are starting to test control.
- If price is moving sideways or consolidating in a range, a hanging man-shaped candle might appear, but it lacks significance because there’s no clear upward momentum to reverse.
Avoid trading hanging men in isolation.
Even if the candle has the textbook shape, it’s meaningless without proper context. Traders should always consider:
- Trend direction: Has the market clearly been in an uptrend?
- Price levels: Is the hanging man forming near a resistance zone or prior high?
- Volume behavior: Was there increased volume on the candle, showing early selling interest?
Hanging men at the bottom of a trend are not bearish.
If a hanging man forms at the bottom of a downtrend, it may look visually identical, but it carries the opposite meaning. This is called a hammer pattern, and it can signal that sellers are losing control. Mistaking a hammer for a hanging man is a common beginner error.
In short, not all hanging men are created equal. A hanging man at the right place and time can be a valuable signal, but without trend context and confirmation, it’s just another candle.
Hanging Man vs Hammer Candlestick Pattern

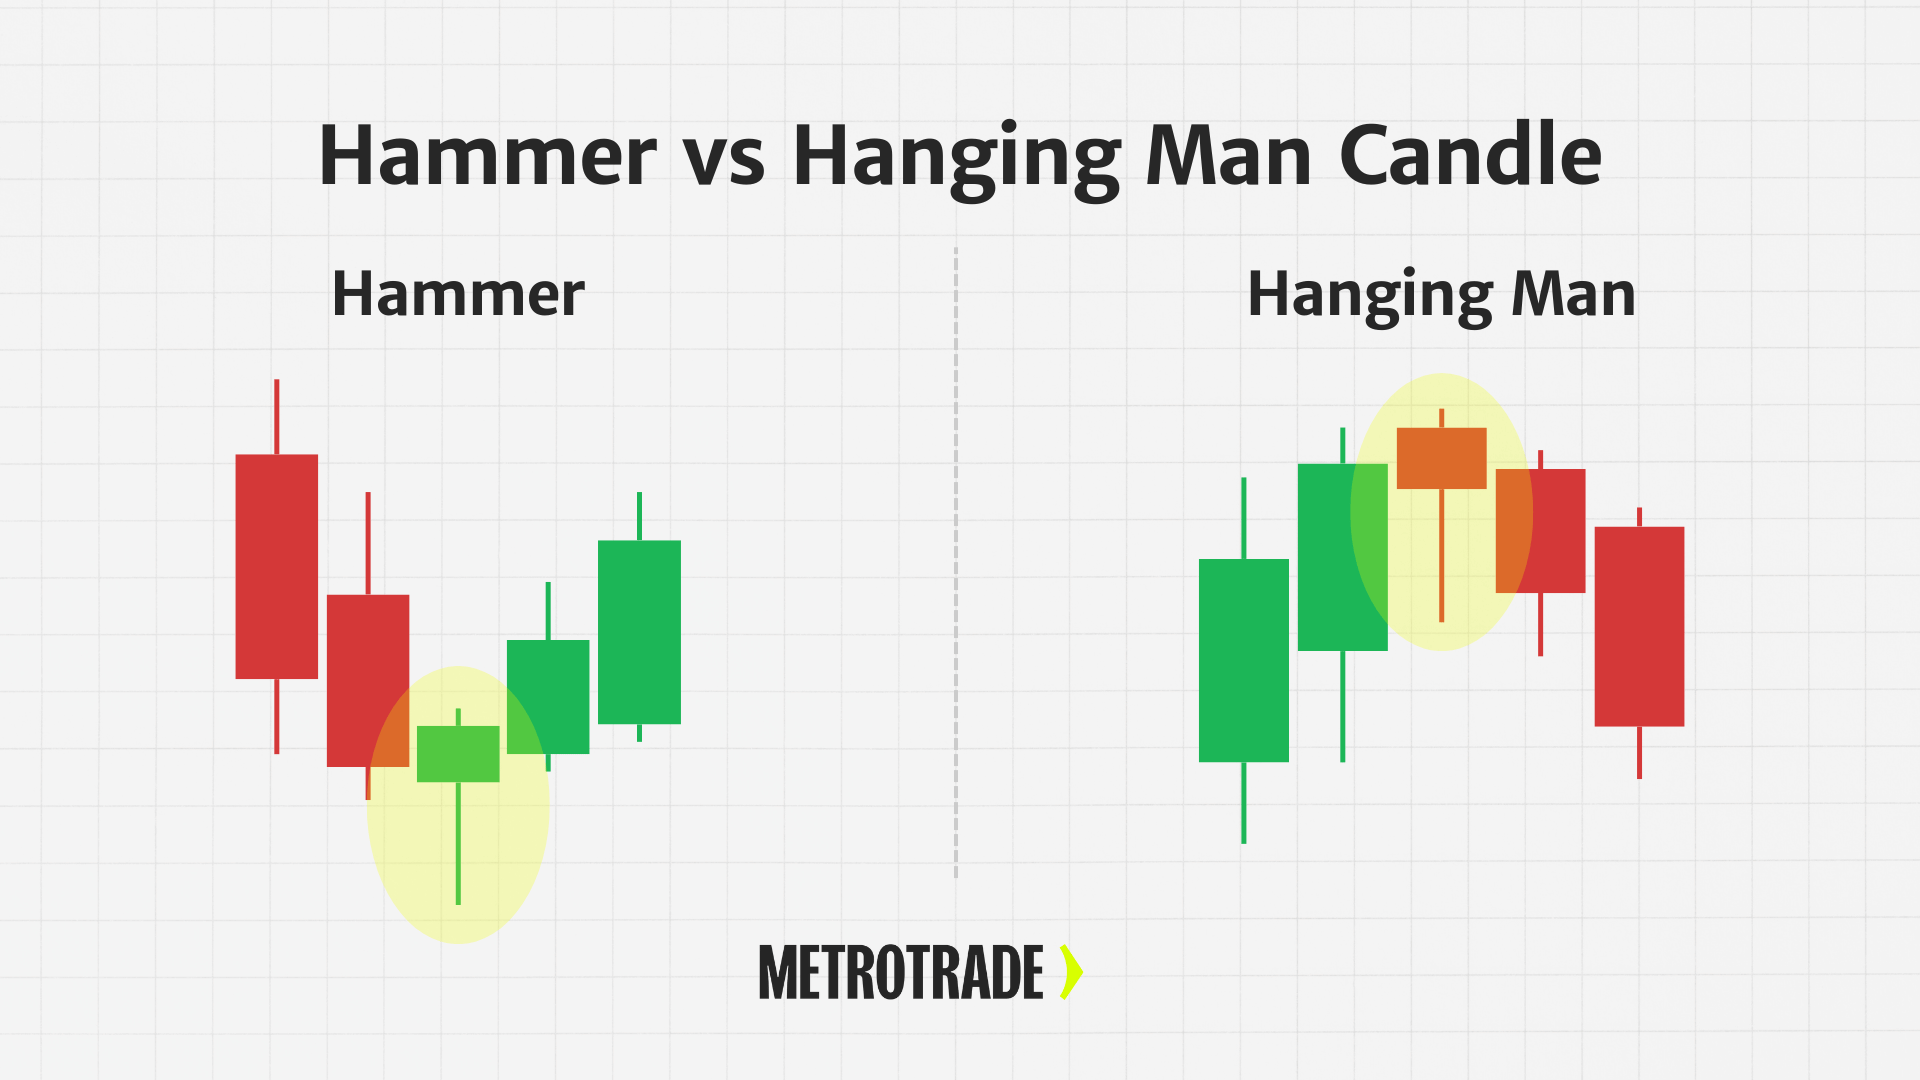
The hanging man and the hammer look almost identical on a chart, but they signal completely opposite things. This is why understanding trend context is critical for interpreting candlestick patterns correctly.
Both candles have:
- A small real body near the top of the range
- A long lower shadow at least twice the height of the body
- Little to no upper shadow
So what’s the difference? It’s all about where the pattern appears.
- Hammer: Forms after a downtrend. Signals a potential bullish reversal.
- Hanging Man: Forms after an uptrend. Signals a potential bearish reversal.
In both cases, the long lower wick shows that sellers were able to drive prices down during the session. The small real body shows that buyers recovered some or most of that loss by the close.
But here’s the key psychological difference:
With a hanging man, the recovery from intraday lows after a strong rally may appear bullish at first glance, but the fact that sellers were able to push the price down significantly raises a red flag. It may signal exhaustion from the bulls and early signs of a reversal to the downside.
How to tell them apart:
Ask yourself:
- What was the trend leading into the candle?
- Are you seeing this at the top of a rally (hanging man) or bottom of a decline (hammer)?
- Are there other technical signals supporting a possible reversal?
Don’t assume a candle’s message based on shape alone. A hammer and hanging man are functionally the same candle, but they tell two very different stories depending on trend direction.
When in doubt, zoom out. Check the broader price action before and after the candle. Context is what turns a single candlestick into a trading signal.
Psychology Behind the Hanging Man Candle
Understanding the psychology of the hanging man candlestick can improve your confidence in using it.
Here’s what’s happening inside the candle:
- Buyers continue the uptrend early in the session and push prices higher.
- At some point, sellers step in aggressively and push prices significantly lower.
- By the close, buyers recover control and bring the price back up, but not enough to erase the intraday weakness.
This shift shows that bullish momentum may be fading and sellers are testing control. It doesn’t guarantee a reversal, but it’s a visible crack in the trend.
In liquid markets like futures, this kind of price behavior often reflects profit-taking, stop runs, or early short positions. A hanging man can signal that buyers are losing momentum and a pullback or reversal may be near.
How to Trade the Hanging Man Candlestick Pattern
Trading the hanging man pattern requires more than just spotting the candle. You need a clear strategy for entry, risk, and target levels. Here’s how to approach it:
Entry point:
Wait for confirmation. Don’t enter a trade as soon as a hanging man forms. Instead, wait for the next candle to close below the hanging man’s low. This follow-through shows that sellers are continuing to gain control.
Volume confirmation:
Look for strong participation. If the hanging man forms with higher-than-average volume, that adds credibility to the pattern. Increased volume suggests that more market participants are beginning to sell.
Stop-loss placement:
Protect your trade above the high. A common method is to place your stop-loss just above the high of the hanging man candle. If the price breaks that level, the pattern has failed, and exiting the trade limits your loss.
Profit targets:
Use support levels or risk-reward ratios. You can target the next logical support zone below the entry or use a 2:1 reward-to-risk ratio. Some traders scale out of positions as the trade moves in their favor.
Confluence:
Combine with other indicators. Hanging man patterns are more effective when confirmed by additional technical signals, such as RSI divergence, resistance rejections, or a bearish MACD crossover. The more confluence, the stronger the setup.
Avoid trading in isolation: always consider the broader chart and trend.
Hanging Man Pattern in Futures Trading
The hanging man candlestick pattern can be applied to a wide range of futures contracts, including:
- E-mini S&P 500 (ES)
- Micro E-mini (MES)
- Crude Oil (CL)
- Gold Futures (GC)
- Euro FX (6E)
In futures markets, the hanging man is especially useful during volatile sessions or after extended rallies. Because futures trade nearly 24 hours, hanging man patterns can appear in overnight sessions or near resistance levels that form during news events.
Using tools like volume overlays, VWAP, and trendline rejection alongside the hanging man pattern can strengthen your entries and exits.
Example Chart Setup Using Hanging Man Candles
Let’s look at a hypothetical setup:
CL (Crude Oil Futures):
- Price rises for several sessions and approaches a resistance zone at $87.50.
- A hanging man forms on the 30-minute chart with high volume.
- The next candle breaks the low and closes bearish.
- A trader enters short, places a stop just above the candle’s high at $87.80, and targets a support level at $85.30.
This type of trade shows how hanging man candles can be used to time reversals or tighten risk during trend exhaustion.
Common Mistakes to Avoid
When learning to trade hanging man candlesticks, it’s easy to fall into a few traps. Avoid these mistakes:
- Ignoring trend context: A hanging man after a downtrend is not bearish—it may be a hammer.
- Trading without confirmation: Acting too early can lead to false entries. Always wait for follow-through.
- Over-relying on the pattern: Candlestick patterns work best when paired with other signals.
- Forgetting volume: Low-volume hanging men are less reliable than high-volume ones.
- Neglecting key levels: Hanging men near resistance zones are stronger than those floating in the middle of a range.
Discipline and patience go a long way when using this pattern.
Platforms and Tools to Spot Hanging Man Patterns
If you’re trading with MetroTrade, you can use MetroTrader, our web and mobile platform, to spot and test hanging man setups.
Using MetroTrader for Pattern Recognition:
- Apply a candlestick chart view in your dashboard.
- Zoom into recent price action and scan for hanging man formations near resistance.
- Apply technical overlays like VWAP or moving averages for confirmation.
- Use RSI or MACD indicators to gauge momentum exhaustion.
Practice with Simulated Trading:
- MetroTrader’s demo mode uses real-time market data.
- Test hanging man setups across MES, crude oil, gold, and other contracts without risk.
- Refine your entry/exit strategies and build muscle memory before going live.
Pros and Cons of Trading the Hanging Man Candlestick
Pros:
- Easy to identify: Clear structure and simple visual cues.
- Good risk-to-reward setups: Often forms near market tops.
- Works across timeframes: Useful for swing traders and intraday futures traders.
Cons:
- Requires confirmation: Can’t trade it on candle shape alone.
- Context-sensitive: Only meaningful after a clear uptrend.
- Can produce false signals: Especially in choppy or sideways markets.
Conclusion
The hanging man candlestick pattern is one of the clearest signs that a market may be topping out. It tells a story of weakening buyer strength and growing selling pressure, making it a useful early warning tool for traders.
By learning to recognize it, confirm it, and manage trades properly, you can use this pattern to time exits, enter short trades, or avoid long entries in overheated markets.
Want to sharpen your technical analysis skills?
Open a free MetroTrader demo account and start practicing hanging man setups today.
FAQs
What is a hanging man candlestick?
A hanging man candlestick is a single-bar chart pattern that signals a potential bearish reversal after an uptrend. It has a small body near the top of the range, a long lower shadow, and little to no upper wick, indicating that sellers briefly gained control during the session.
What does the hanging man candlestick pattern mean?
The hanging man candlestick is a bearish reversal pattern that appears after an uptrend. It suggests that sellers entered the market during the session, and if followed by a lower close, it may signal a potential shift from bullish to bearish momentum.
How do you identify a hanging man candlestick?
A hanging man candlestick has a small real body near the top of the price range, a long lower shadow at least twice the size of the body, and little or no upper wick. It must appear after an uptrend to carry bearish significance.
Is the hanging man candlestick bullish or bearish?
The hanging man is considered a bearish candlestick pattern. It signals possible trend exhaustion at the top of a rally and often serves as an early warning that sellers are gaining control.
What is the difference between a hanging man and a hammer candle?
A hanging man and a hammer look nearly identical but appear in opposite contexts. A hanging man forms after an uptrend and signals potential downside, while a hammer appears after a downtrend and signals possible upside.
Do you need confirmation to trade the hanging man candlestick?
Yes, traders typically wait for a confirmation candle, such as a bearish close below the hanging man’s low, before entering a short position. This helps filter out false signals.
Can you use the hanging man candlestick in futures trading?
Yes, the hanging man pattern is commonly used in futures trading. It helps traders spot potential tops or reversals in contracts like S&P 500 E-minis, crude oil, gold, and more.
The content provided is for informational and educational purposes only and should not be considered trading, investment, tax, or legal advice. Futures trading involves substantial risk and is not suitable for every investor. Past performance is not indicative of future results. You should carefully consider whether trading is appropriate for your financial situation. Always consult with a licensed financial professional before making any trading decisions. MetroTrade is not liable for any losses or damages arising from the use of this content.


